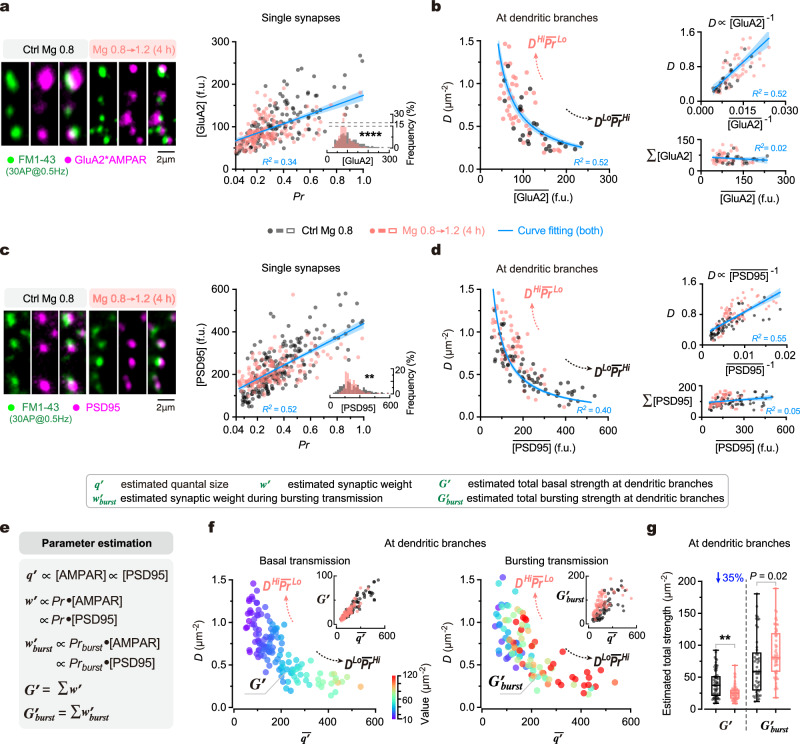
Fig. 2. Influence of synaptic configuration on excitatory synaptic transmission in dendrites.
a Left, confocal images to show juxtaposed FM1-43+ and GluA2*AMPAR+ puncta at example dendritic segments. Right, synaptic [GluA2] against Pr in single synapses (n = 140, 167 synapses from 3, 3 repeats; linear regression, R2 = 0.34, P < 0.0001). Inset, shifted synaptic [GluA2] distribution (two-sided Kolmogorov–Smirnov test, ****P < 0.0001). b Left, plot of D against the mean [GluA2] () of synapses at dendritic branches (n = 26, 42 branches from 3, 3 repeats; hyperbolic fitting, R2 = 0.52). Top right, D against 1/[GluA2] (linear regression, R2 = 0.55, P < 0.0001). Bottom right, total [GluA2] (Σ[GluA2]) against (linear regression, R2 = 0.018, P = 0.28). c, d Similar to (a, b), but immunostaining for PSD95 (n = 210, 163 synapses from 4, 3 repeats for c; 65, 62 branches from 4, 4 repeats for d). Two-sided Kolmogorov test (c, inset), **P = 0.0019. Linear regressions (c, d), R2 = 0.52, 0.55, 0.046, P < 0.0001, <0.0001, = 0.0150. Hyperbolic fitting (d, left), R2 = 0.40. e Formulas for estimating quantal size (q’), synaptic weight (w’) and bursting synaptic weight (w’burst) of single synapses, as well as total basal strength (G’) and total bursting strength (G’burst) of dendritic branches. f The relationship between D, and G’ (left; n = 65, 62 branches from 4, 4 repeats) or G’burst (right; n = 49, 56 branches from 3, 3 repeats) (coded by pseudo color) at individual dendritic branches (data from separate measurements). Insets, G’~ and G’burst ~ associations. The of individual synapses was estimated by postsynaptic [PSD95]. g Box-whisker plot of G’ and G’burst from physiological and elevated Mg2+ conditions (n = 65, 62, 49, 56 branches from 4, 4, 3, 3 repeats; the same data as in f). Box borders/line, quantiles/median; whiskers, min and max. Two-sided Kolmogorov–Smirnov tests, **P = 0.0016, *P = 0.0162. In (a–d), blue lines/error bands, fitted curves/95% CIs. Source data are provided as a Source Data file.

