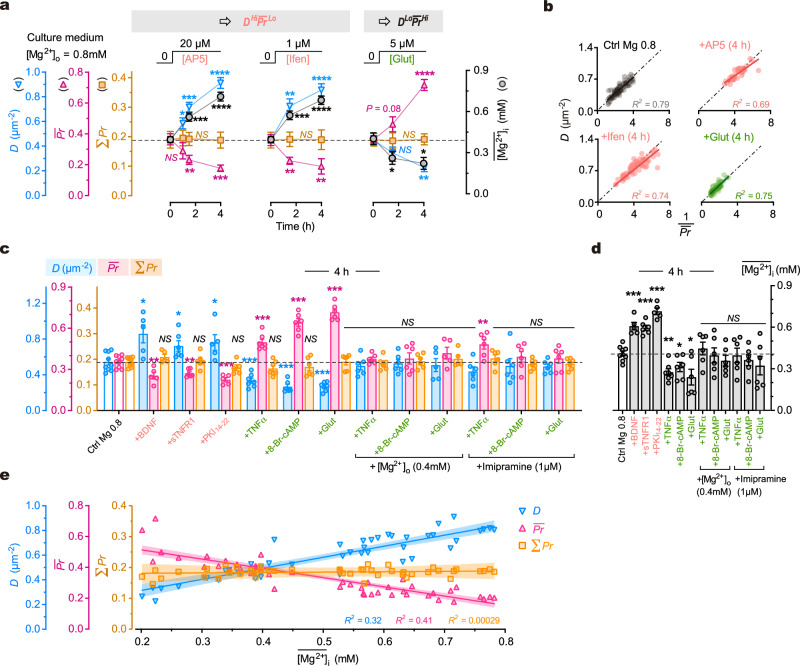
Fig. 6. Multiple pathways converge on intracellular Mg2+ levels in regulating synaptic configuration.
a Time courses of changes in synaptic configuration and (mM) after various treatments (for timepoints from left to right, n = 6, 7, 8, 8, 6, 5, 6, 5, 7, 6 repeats for configuration measurements, 8, 7, 7, 9, 6, 8, 8, 8, 8 repeats for [Mg2+]i measurements). Two-sided unpaired t-tests (time 4 h vs. 0 h). For ΣPr, P = 0.8979, 0.9945, 0.9370; for D, P = 0.0334, < 0.0001, = 0.0015; for , P = 0.0003, 0.0093, < 0.0001; for [Mg2+]i, P < 0.0001, < 0.0001, = 0.0109. b Plots of D against 1/ at dendritic branches 4 h after various treatments (n = 81, 42, 64, 57 branches from 7, 5, 6, 5 for control, AP5, ifenprodil and glutamate, respectively). Solid lines, linear regressions (P < 0.0001 for all). Dash-dot lines, bisectors. c, d Measurements of D, , ΣPr and 4 h after various treatments (left to right, n = 9, 5, 6, 5, 7, 6, 6, 6, 6, 5, 6, 6, 6 repeats). Two-sided Mann-Whitney tests (vs. control). For D, P = 0.0190, 0.0360, 0.0420, 0.0007, 0.0004, 0.0004, 0.4559, 0.8639, 0.6993, 0.1135, 0.3277, 0.4559; for , P = 0.0070, 0.0048, 0.0010, 0.0002, 0.0004, 0.0004, 0.6070, 0.8639, 0.2977, 0.0076, 0.3277, 0.5287; for [Mg2+]i, P = 0.0010, 0.0004, 0.0010, 0.0021, 0.0360, 0.0256, 0.4559, 0.7756, 0.2238, > 0.9999, 0.3277, 0.3884. e Plot of D, and ΣPr against at the same timepoints after various treatments (n = 46 various conditions from a, c, d and Fig. 4a; linear regressions, P < 0.0001, < 0.0001, = 0.79). Lines, fitted curves. Error bands, 95% CIs. Data are presented as mean ± SEM. NS, no significance, *P < 0.05, **P < 0.01, ***P < 0.001, ****P < 0.0001. Source data are provided as a Source Data file.

