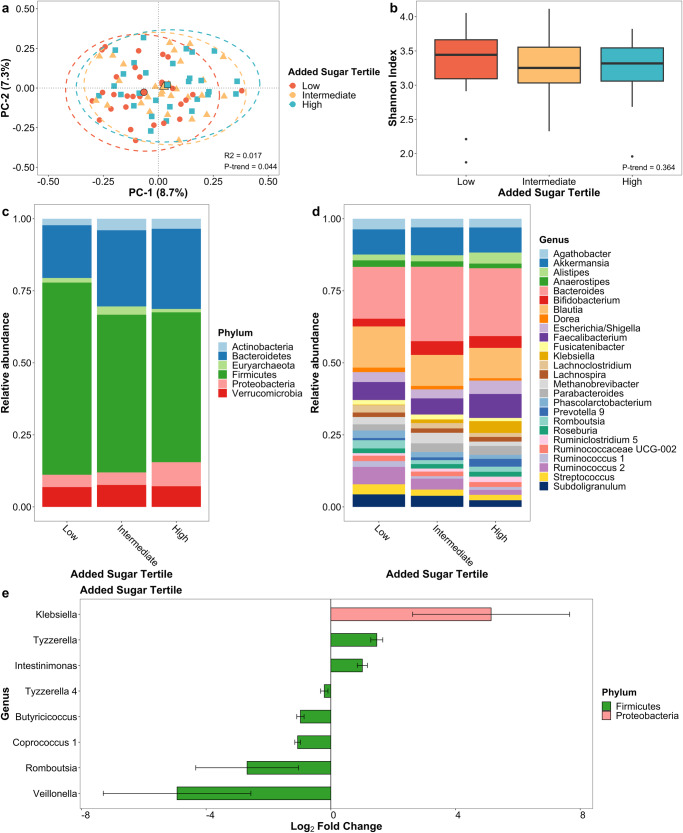
Fig. 3. Gut microbiome of PD patients varies by added sugar intake.
a Principal coordinate analysis plot of the microbiome by added sugar intake tertile. b Box plot of microbial diversity using Shannon index by added sugar intake tertile. Taxonomic summary plot of relative abundance at c phylum and d genus level (≥1% relative abundance) by added sugar intake tertile. e Differential abundance of microbial taxa at genus level by added sugar intake after adjusting for age, sex, race, and sequencing platform. Taxa in (e) are associated with categorical added sugar intake tertile at q-trend <0.05 and continuous added sugar intake at q-value < 0.05. Error bars represent 95% confidence intervals.

