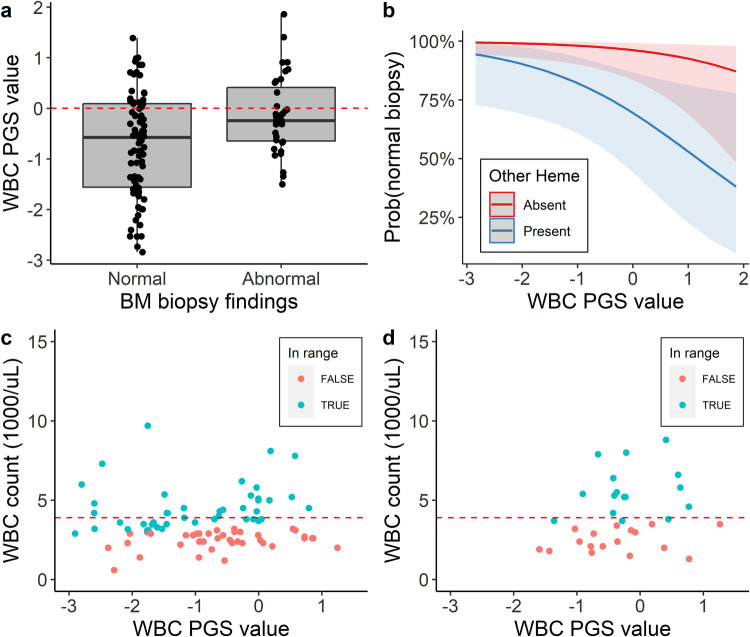
Fig. 3. PGS associations with bone marrow biopsy outcomes.
a Distribution of the PGSWBC values among 117 BioVU participants who underwent a bone marrow biopsy for a clinical indication that included a low WBC count. Results are stratified by whether the biopsy identified pathology (abnormal, n = 35) or not (normal, n = 82). Box plots show the median value, interquartile range (gray region), and maximum and minimum values (whiskers) for each stratum. The dashed red line indicates the median PGSWBC value for the overall BioVU population. b Predicted probabilities (with standard errors) of a normal biopsy finding. Results are stratified by whether the indication for the biopsy included other hematological abnormalities (labeled as present or absent) in addition to a low WBC count. Probabilities are based on a multivariable logistic regression model, adjusted for age, sex, and presence of a hematological abnormality. c, d Scatterplots showing the WBC count at the time of biopsy versus the PGSWBC values for participants with a c normal or d abnormal biopsy result. Points are colored to denote whether the observed WBC count fell within the range (i.e. above the 2.5th percentile of the distribution) of WBC counts observed among individuals in the WBC cohort whose PGSWBC value was within 0.2 standard deviations. The dashed red line denotes the lower bound of the clinical reference ranges.

