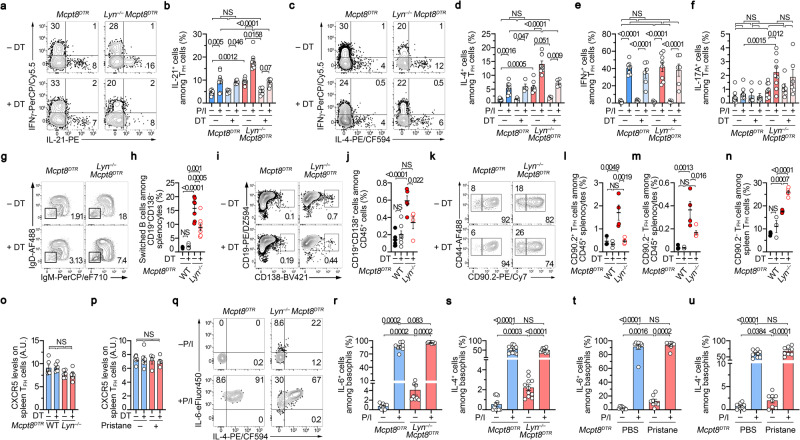
Fig. 3. Basophils control TFH abilities to produce IL-21 and IL-4 in the lupus-like context.
a, c Contour plots showing PMA and Ionomycin (P/I)-induced IFNγ, IL-21, and IL-4 productions by TFH cells (as defined in supplementary Fig. 2d-f) in splenocytes from aged Mcpt8DTR or Lyn–/–Mcpt8DTR mice basophil-depleted (DT + ) or not (DT–). Proportions (%) of IL-21+ (b) (n = 9/6/9/6), IL-4+ (d) (n = 9/4/9/4), IFNγ + (e) (n = 8/6/8/6) and IL-17A+ (n = 9/6/9/6) (f) TFH cells in splenocytes as in (a). g Contour plots of switched B cells (IgM–IgD–) among spleen CD45+TCRβ–CD19+CD138– cells in mice as in (a). h Proportions (%) of switched B cells among CD19+CD138– splenocytes as in (g) (n = 6/6/7/8). i Contour plots of CD19+CD138+ cells among CD45+ cells from co-culture of sorted TFH cells from mice as in (g) and WT B cells. j Proportions (%) of CD19+CD138+ cells among CD45+ cells as in (i) (n = 6/7/5/4). k Contour plots of CD90.2+ and CD90.2– TFH cells among spleen TFH cells from mice as in (a). Proportions (%) of CD90.2+ (l) and CD90.2– (m) TFH cells among CD45+ splenocytes from mice as in (a) (n = 3/3/4/5). n Proportions (%) of CD90.2– TFH cells among spleen TFH cells as in (k) from mice as in (g) (n = 3/3/4/5). CXCR5 expression on spleen TFH cells from mice as in (a–n) (o) and as in (t, u) (p). q Contour plots showing non-stimulated (–) and P/I-induced (+) IL-6 and IL-4 productions by spleen basophils from aged Mcpt8DTR or Lyn–/–Mcpt8DTR mice. Proportions (%) of IL-6+ (r) (n = 8/8/8/8) and IL-4+ (s) (n = 11/11/11/11) basophils in splenocytes as in (a). Proportions (%) of IL-6 (t) (n = 9/9/8/8) and IL-4 (u) (n = 9/9/8/8) producing cells among basophils in splenocytes stimulated with P/I (+) or not (–) from PBS-injected Mcpt8DTR (blue) or pristane-injected Mcpt8DTR (red) mice. b, d–f, h, j, l–p, r–u Results are from at least three independent experiments and presented as individual values in bars representing the mean values ± s.e.m. Statistical analyses were by two-way ANOVA followed by Tukey’s multiple comparisons test (b, d–f, h, j, l–p) or by Kruskal–Wallis tests followed by two-sided Mann–Whitney U test between the indicated groups (r–u). P values are shown above each bracket. NS not significant. Source data are provided in the Source Data file.

