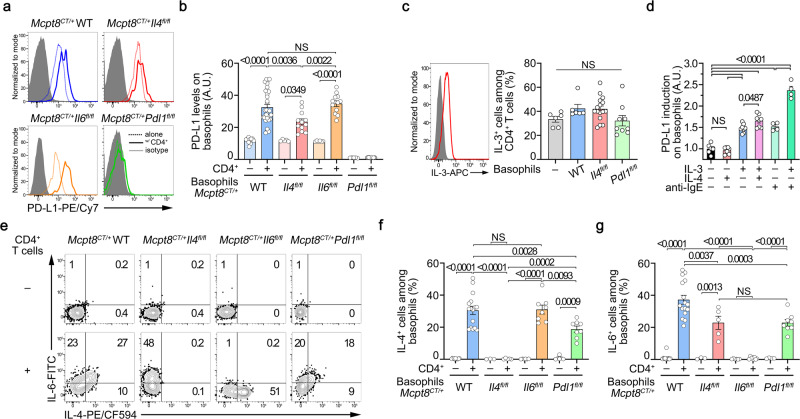
Fig. 5. CD4+ T cells promotes ex vivo PD-L1 and IL-4 expressions by basophils.
a Histograms of PD-L1 expression on basophils cultured without (dotted) or with (solid) activated naïve CD4+ T cells as in Fig. 4 (gray filled: isotype control staining). b PD-L1 expression levels on basophils cultured without (–, lighter colors) or with (+, darker colors) activated naïve CD4+ T cells (n = 14/31/5/12/6/12/5/12). c Left. Intracellular IL-3 staining in WT CD3/CD28-activated naïve CD4+ T cells after 3 days of culture (red line) (gray filled: isotype control staining). Right. Proportions (%) of IL-3+ cells among CD4+ T cells non-restimulated in the same samples as in Fig. 4f (n = 6/9/16/9). d PD-L1 expression induction on WT basophils after stimulation of splenocytes with 1 ng/mL of IL-4 (red), of IL-3 (blue), both (purple), 100 ng/mL of anti-IgE without (light green) or with (green) IL-3 for 20 h (n = 8/8/8/8/4/4) (normalized to unstimulated conditions mean value). e Contour plots of IL-6 and IL-4 spontaneous production by basophils of the indicated genotype after co-culture without (–) or with activated CD4+ T cells. Proportions (%) of spontaneous IL-4+ (f) and IL-6+ (g) basophils of the indicated genotypes co-cultured (+) or not (–) with WT CD3/CD28-activated naïve CD4 + T cells (n = 11/16/3/5/6/8/4/8). f, g Results for IL-13 and PMA/Ionomycin restimulated cells are shown in Supplementary Fig. 7k–n. a–g Results are from at least three independent experiments and presented as individual values in bars representing the mean ± s.e.m. b–d, f, g Statistical analyses were by one way ANOVA followed by Tukey’s multiple comparisons tests between the indicated groups. P values are shown above each bracket. NS not significant. A.U. arbitrary units. Source data are provided in the Source Data file.

