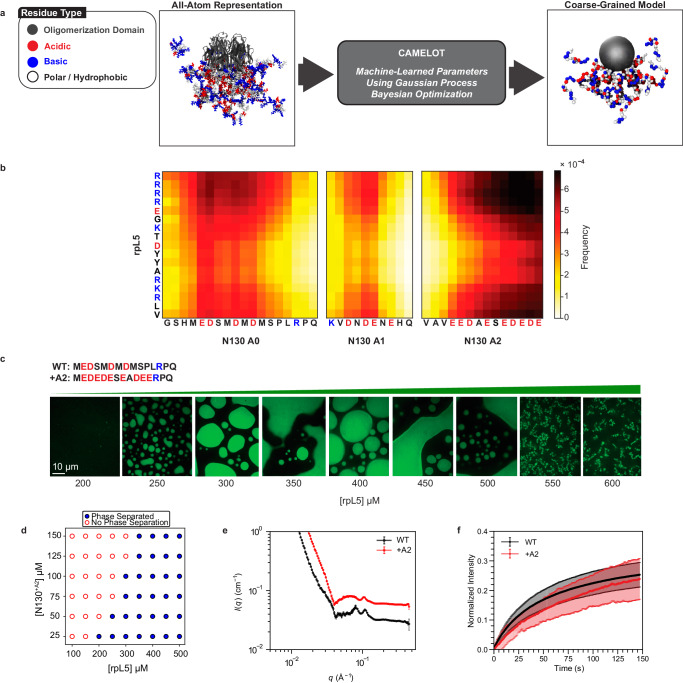
Fig. 2. Coarse-grained simulations of N130 + rpL5 condensates highlight the importance of an N-terminal acidic region (A0) within N130.
a Coarse-graining procedure for N130 and rpL5 systems. To generate sequence- and system-specific CG models for N130 and rpL5 peptides, we start with atomistic Monte Carlo simulations of individual molecules that are based on the ABSINTH implicit solvation model and forcefield paradigm87. Ions are modeled explicitly in these simulations. We then prescribe a CG model for the system. Here, the residues of the PD are collectively modeled as one large bead depicted in gray. Next, for regions outside the PD, the residues are single beads, and the bead types are organized into three groups: 1: E,K,R,D; 2: V,F,M,I,L,Y,Q,N,W,H; and 3: A,P,G,S,T,C, respectively. To determine the optimal interaction parameters for the CG model, we used the CAMELOT algorithm86. b Bead-to-bead contact maps from coarse-grained simulations of dense phases comprising a 1:3 ratio of N130 and rpL5. The A1 and A2 regions interact favorably with rpL5 peptides. The contact maps reveal interactions involving a region we refer to as A0. c Confocal microscopy images of phase separation at a fixed concentration of N130+A2 upon titrating with rpL5. The A0 tract in the wild type is replaced with the reversed sequence of the A2 tract. Microscopy experiments were repeated in three independent experiments with similar results. d Two-component phase boundary for N130+A2 + rpL5, showing the result of concentration titrations. e Comparative SANS curves for the WT N130 + rpL5 and +A2 mutant + rpL5. SANS data were collected with 200 µM N130 and 600 µM rpL5. For clarity, the curve for N130+A2 + rpL5 is shifted upwards. The data correspond to a single measurement (), with the error bars calculated as in Fig. 1e. f FRAP curves for the condensates containing N130 and N130+A2. FRAP curves were collected at 100 µM N130 and 400 µM rpL5 with 12 replicates (). Error bars represent the standard deviation of the mean.

