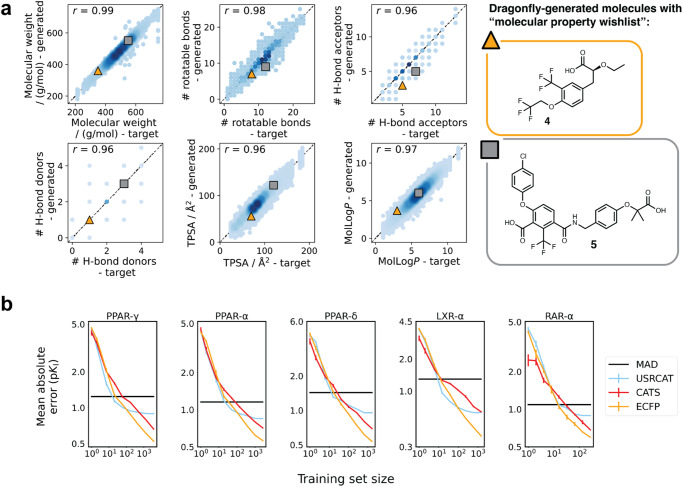
Fig. 2. Property translation with DRAGONFLY and quantitative structure-activity relationship (QSAR) models.
a The scatter plots depict the translation of desired properties into the generated molecules, with squared Pearson correlation coefficients (r2) >0.95 for all investigated molecular properties. The high correlation suggests a strong relationship between the desired properties and the generated molecules. Properties include molecular weight, rotatable bonds, hydrogen bond acceptors, hydrogen bond donors, polar surface area, and lipophilicity calculated as MolLogP values33. Two exemplary molecules 4 and 5 and their position in the six scatter plots are visualized, showing that the desired molecular properties are accurately represented in the generated molecules. b The double-logarithmic learning curves depict how the prediction error of ligand-based QSAR models for three descriptors (extended connectivity fingerprint (ECFP4)36, chemical advanced template search (CATS, absolute values)37, ultra-fast shape Recognition with atom types (USRCAT)38) varies with the size of the data set, focusing on five selected drug targets related to nuclear hormone receptors. Each plot displays a horizontal line representing the mean absolute deviation (MAD) of the training data. The error bars on the plots represent the standard deviation observed during a 10-fold cross-validation. Source data are provided as a Source Data file.

