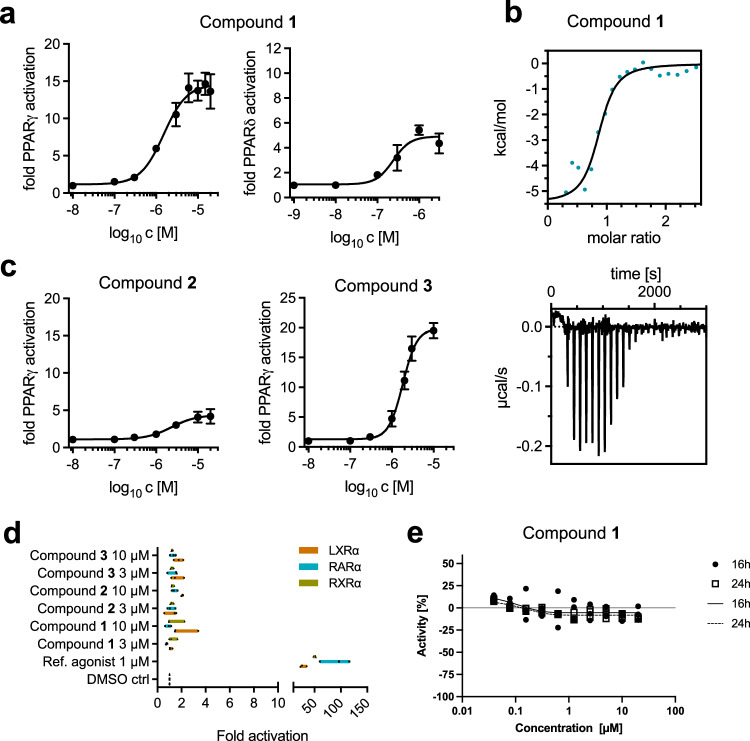
Fig. 5. Biological characterization of compounds 1–3.
The graphs in panels a and c display a nonlinear fitting curve derived from the mean values of three measurements (N = 3). The graph in panel d shows mean values of three measurements (N = 3). Error bars, represented by whiskers, indicate the standard deviations. a Peroxisome proliferator-activated receptor (PPAR) activation by compounds 1, 2 and 3 using a hybrid reporter gene assay. b Result of an isothermal titration calorimetry experiment (N = 2) measuring direct binding of compound 1 to PPARγ. c Dose-response curves from a hybrid reporter gene assay for compounds 2 and 3 measuring PPARγ activation. d Receptor selectivity of compounds 1, 2, and 3 for activation of liver X receptor (LXR)α, retinoic acid receptor (RAR)α, and retinoid X receptor (RXR)α. e Cytotoxicity of compound 1 on HEK293T cells for two time points (i.e., 16 h and 24 h), 10 different concentrations (i.e., 0.05–20 μM) and 10000 cells ⋅ well−1 (N = 3). Scale reference: The axes are scaled through neutral control (i.e., Dimethylsulfoxid [DMSO], set to 0) and inhibitor control wells (i.e., 20 μM Staurosporine114, set to −100). Source data are provided as a Source Data file.

