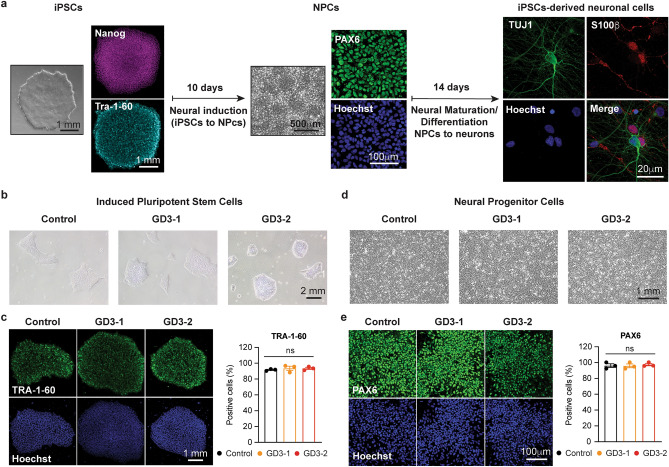
Figure 1.
Normal iPSCs and NPCs properties in cells generated by 2 Gaucher disease patients. (a) Schematic representation of a three-steps neuronal differentiation protocol starting from iPSCs (left), NPCs (middle) and iPSCs-derived neuronal cells (Right) with corresponding protein marker expression. (b) Bright field images of iPSCs colonies in Control (left), GD3-1 (middle) and GD3-2 (right) samples. (c) (Left) TRA-1–60 and Hoechst fluorescence in control, GD3-1 and GD3-2 iPSCs groups. (Right) Summary of TRA-1–60 positive cells detected by flow cytometry in control, GD3-1 and GD3-2 iPSCs groups (Kruskal–Wallis test: H(2) = 1.07, p = 0.66, n = 3 technical replicates). (d) Bright field images of NPCs in Control (left), GD3-1 (middle) and GD3-2 (right) samples. (e) (Left) PAX6 and Hoechst fluorescence in control, GD3-1 and GD3-2 iPSCs groups. (Right) Summary of PAX6 positive cells detected by flow cytometry in control, GD3-1 and GD3-2 iPSCs groups (Kruskal–Wallis test: H(2) = 0.84, p = 0.70, n = 3 technical replicates).

