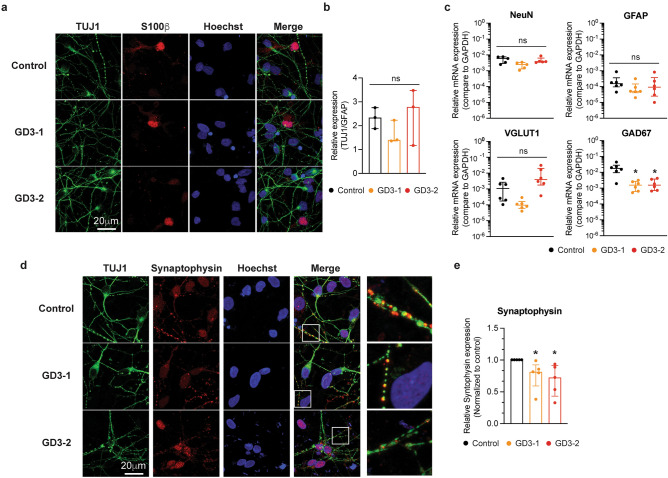
Figure 2.
Characterization of neuronal subtype differentiation and synaptic marker in iPSCs-derived neuronal cells from GD patients. (a) Representative images of TUJ1, S100b, Hoechst and merge fluorescence in iPSCs-derived neuronal cells from control (top), GD3-1 (middle) and GD3-2 (bottom) samples. (b) Summary of the relative expression of TUJ1 over GFAP immunofluorescence per cell in GD3-1 and GD3-2 compared to control group (Kruskal–Wallis test: H(2) = 1.69, p = 0.51, n = 3 technical replicates). (c) Bar graphs representing the relative mRNA expression levels of NeuN (top left, Kruskal–Wallis test: H(2) = 6.02, p = 0.08 for Control vs. GD3-1, p > 0.99 for Control vs. GD3-2, n = 5 technical replicates), VGLUT1 (Kruskal–Wallis test: H(2) = 11.24, p = 0.09 for Control vs. GD3-1, p = 0.09 for Control vs. GD3-2, n = 6 technical replicates), GAD67 (bottom left, Kruskal–Wallis test: H(2) = 8.57, p = 0.01 for Control vs. GD3-1, p = 0.04 for Control vs. GD3-2, n = 6 technical replicates) and GFAP (bottom right, Kruskal–Wallis test: H(2) = 2.21, p = 0.35, n = 6 technical replicates) in iPSCs-derived neuronal cells from control, GD3-1 and GD3-2 samples. (d) Representative images of TUJ1, Synaptophysin, Hoechst and merge fluorescence in iPSCs-derived neuronal cells from control (top), GD3-1 (middle) and GD3-2 (bottom). e. Summary of the relative average synaptophysin immunofluorescence per cell in GD3-1 and GD3-2 compared to control group (Kruskal–Wallis test: H(2) = 9.85, p = 0.02 for Control vs. GD3-1, p < 0.01 for Control vs. GD3-2, n = 5 technical replicates).

