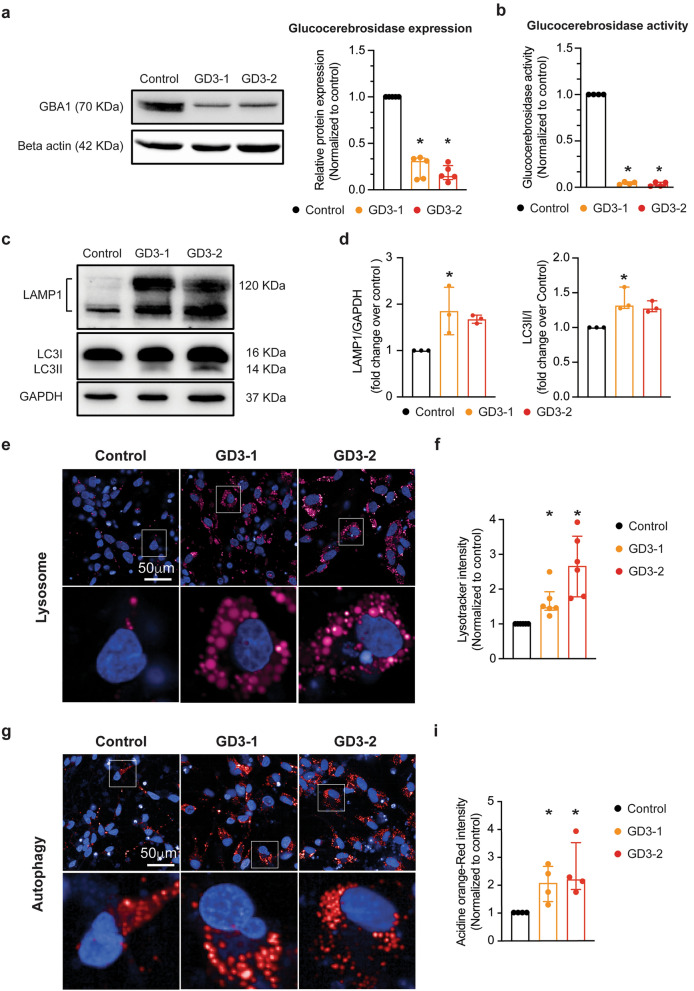
Figure 3.
Investigation of GD phenotypes in iPSCs-derived neuronal cells acquired from neuronopathic GD. (a) (Left) Representative western blot images of GBA1 and beta actin from iPSCs-derived neuronal cells from control, GD3-1 and GD3-2 samples. (Right) Bar graph summarizing of the relative normalized GBA1 protein expression in GD3-1 and GD3-2 compared to control group (Kruskal–Wallis test: H(2) = 10.14, p = 0.04 for Control vs. GD3-1, p < 0.01 for Control vs. GD3-2, n = 5 technical replicates). (b) Bar graphs representing the relative glucocerebrosidase activity in iPSCs-derived neuronal cells (right, Kruskal–Wallis test: H(2) = 8.01, p = 0.04 for Control vs. GD3-1, p < 0.01 for Control vs. GD3-2, n = 4 technical replicates) in GD3-1 and GD3-2 compared to control group. (c) Representative cropped western blot images of LAMP1, LC3I/II and GAPDH from iPSCs-derived neuronal cells from control, GD3-1 and GD3-2 samples (all replicate images are included in the supplementary information file). (d) Bar graph summarizing of the relative normalized LAMP1(left, Kruskal–Wallis test: H(2) = 5.79, p = 0.02 for Control vs. GD3-1, p = 0.07 for Control vs. GD3-2, n = 3 technical replicates) and LC3I/II (right, Kruskal–Wallis test: H(2) = 6.16, p = 0.02 for Control vs. GD3-1, p = 0.10 for Control vs. GD3-2, n = 3 technical replicates) protein expression in GD3-1 and GD3-2 compared to control group. (e) (Top) Representative images of SiR lysosome staining in iPSCs-derived neuronal cells from control, GD3-1 and GD3-2 samples. (Bottom left) Expanded micrograph of boxed region demarcated in the corresponding images. (f) Summary of the relative average SiR lysosome staining per cell in GD3-1 and GD3-2 compared to control group (Kruskal–Wallis test: H(2) = 14.9, p = 0.04 for Control vs. GD3-1, p < 0.01 for Control vs. GD3-2, n = 6 technical replicates). (g) (Top) Representative images of acridine orange staining in iPSCs-derived neuronal cells from control, GD3-1 and GD3-2 samples. (Bottom) Expanded micrograph of boxed region demarcated in corresponding images. (h) Summary of the relative average acridine orange staining per cell in GD3-1 and GD3-2 compared to control group (Kruskal–Wallis test: H(2) = 7.69, p = 0.04 for Control vs. GD3-1, p = 0.03 for Control vs. GD3-2, n = 4 technical replicates).

