Figure 5.
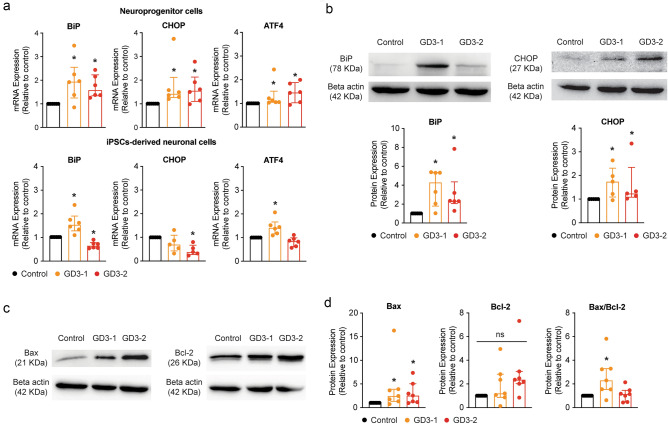
Observation of ER stress and UPR activation in iPSCs-derived neuronal cells from GD. (a) (Top) Bar graphs representing the relative mRNA expression levels of BiP (left, Kruskal–Wallis test: H(2) = 8.20, p = 0.02 for Control vs. GD3-1, p = 0.03 for Control vs. GD3-2, n = 6 technical replicates), CHOP (middle, Kruskal–Wallis test: H(2) = 8.24, p < 0.01 for Control vs. GD3-1, p = 0.02 for Control vs. GD3-2, n = 6 technical replicates) and ATF4 (right, Kruskal–Wallis test: H(2) = 8.20, p = 0.02 for Control vs. GD3-1, p = 0.01 for Control vs. GD3-2, n = 6 technical replicates) in NPCs from control, GD3-1 and GD3-2 samples. (Bottom) Bar graphs representing the relative mRNA expression levels of BiP (left, Kruskal–Wallis test: H(2) = 15.73, p = 0.04 for Control vs. GD3-1, p = 0.04 for Control vs. GD3-2, n = 6 technical replicates), CHOP (middle, Kruskal–Wallis test: H(2) = 7.55, p = 0.11 for Control vs. GD3-1, p < 0.01 for Control vs. GD3-2, n = 5 technical replicates) and ATF4 (right, Kruskal–Wallis test: H(2) = 12.75, p = 0.02 for Control vs. GD3-1, p = 0.21 for Control vs. GD3-2, n = 6 technical replicates) in iPSCs-derived neuronal cells from control, GD3-1 and GD3-2 samples. (b) (Top) Representative cropped western blot images of GBA1 and CHOP from iPSCs-derived neuronal cells from control, GD3-1 and GD3-2 samples. (Bottom) Bar graphs summarizing of the relative normalized BiP (Kruskal–Wallis test: H(2) = 11.9, p < 0.01 for Control vs. GD3-1, p < 0.01 for Control vs. GD3-2, n = 6 technical replicates) and CHOP (Kruskal–Wallis test: H(2) = 6.24, p = 0.04 for Control vs. GD3-1, p = 0.03 for Control vs. GD3-2, n = 5 technical replicates) protein expression in GD3-1 and GD3-2 compared to control group. (c) Representative cropped western blot images of Bax (left) and Bcl-2 (right) from iPSCs-derived neuronal cells from control, GD3-1 and GD3-2 samples. (d) Bar graphs summarizing of the relative normalized Bax (Kruskal–Wallis test: H(2) = 7.09, p = 0.02 for Control vs. GD3-1, p = 0.03 for Control vs. GD3-2, n = 7 technical replicates) , Bcl-2 (Kruskal–Wallis test: H(2) = 5.46, p = 0.06, n = 7 technical replicates) and the ratio of Bax/Bcl-2 (Kruskal–Wallis test: H(2) = 7.93, p < 0.01 for Control vs. GD3-1, p = 0.36 for Control vs. GD3-2, n = 7 technical replicates) protein expression in GD3-1 and GD3-2 compared to control group. All replicate western blot images are included in the supplementary information file.

