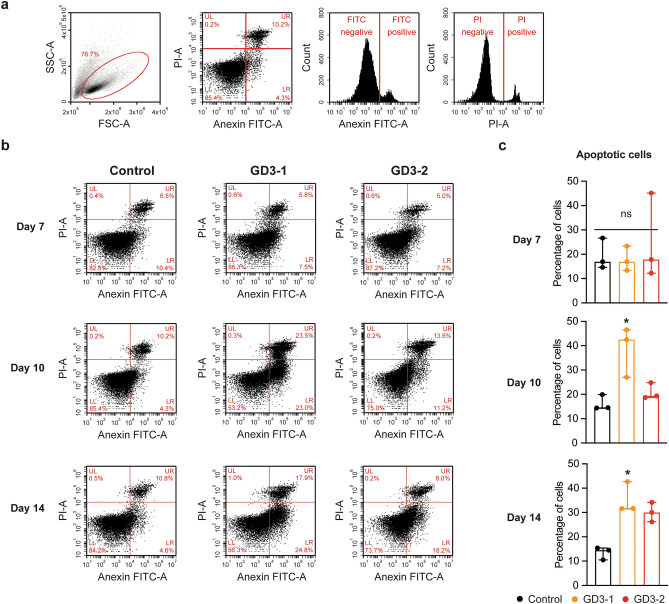
Figure 6.
Different in neuronal apoptosis in iPSCs-derived neuronal cell from GD patients. (a) Scatter plots represent a complete gating strategy in the flow cytometry analysis. (b) Scatter plots represent the intensities of PI and AnnexinV-FITC fluorescent at day 7, 10 and 14 of neuronal differentiation in control, GD3-1 and GD3-2 groups. (c) Bar graphs represent the percentage of apoptotic cells at day 7 (Kruskal–Wallis test: H(2) = 0.16, p = 0.95, n = 3 technical replicates), day 10 (Kruskal–Wallis test: H(2) = 5.97, p = 0.02 for Control vs. GD3-1, p = 0.46 for Control vs. GD3-2, n = 3 technical replicates) and day 14 (Kruskal–Wallis test: H(2) = 5.96, p = 0.02 for Control vs. GD3-1, p = 0.10 for Control vs. GD3-2, n = 3 technical replicates) of neuronal differentiation.

