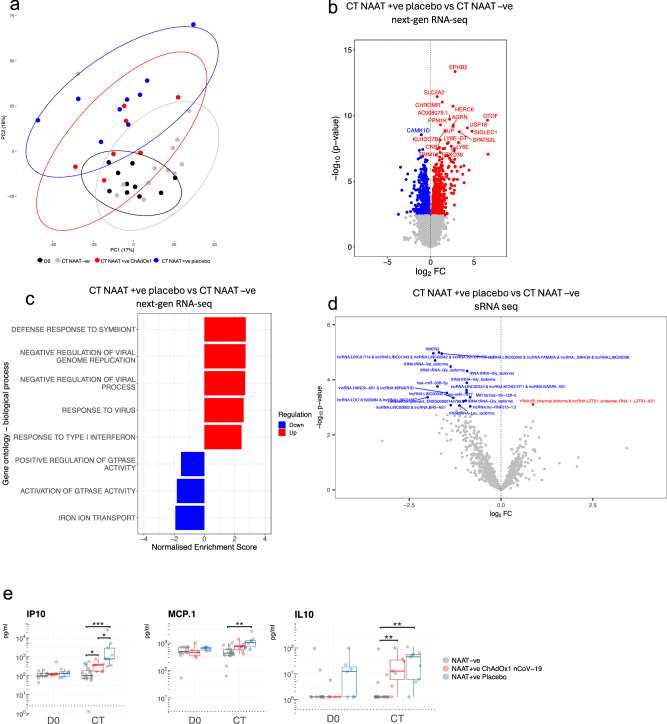
Fig. 2. Differential signatures and features in acute COVID-19 compared with symptomatic controls.
a Principal component analysis of blood RNA-seq transcriptome (next-gen RNA-seq) of study participants during symptomatic episodes consistent with COVID-19, with 95% confidence intervals ellipses. D0 n = 10, CT NAAT-ve n = 13, CT NAAT+ve ChAdOx1 nCoV-19 n = 7, CT NAAT+ve placebo n = 9. b Volcano plot comparing the next-gen RNA-seq blood transcriptome of NAAT+ve (placebo vaccine, n = 9) and NAAT–ve individuals at CT (n = 13). Blue = higher in NAAT-ve (FDR < 0.05), red = higher in NAAT+ve (FDR < 0.05). Differential expression analysis was performed using a two-sided moderate t test. c GSEA gene ontology biological process when comparing NAAT+ve (placebo vaccine, n = 9) compared with NAAT-ve individuals (n = 13) at CT. d Volcano plot comparing the small RNA-seq blood transcriptome of NAAT+ve (placebo vaccine, n = 9) and symptomatic NAAT-ve individuals (n = 13) at CT. Blue = higher in at NAAT-ve (FDR < 0.05), red = higher in NAAT+ve (FDR < 0.05). Differential expression analysis was performed using a two-sided moderate t test. e Serum cytokine levels measured at baseline (D0, paired samples from NAAT-ve n = 11, NAAT+ve ChAdOx1 nCoV−19 n = 5, NAAT+ve placebo n = 7) and CT (NAAT-ve n = 17, NAAT+ve ChAdOx1 nCoV-19 n = 7, NAAT+ve placebo n = 9). Each dot represents a volunteer. The centre line denotes the median value (50th percentile, Q2), the box contains the 25th (Q1) to 75th (Q3) percentiles of dataset. The whiskers mark the Q1 – 1.5*IQR and Q3 + 1.5*IQR. Dashed line represents limit of detection. Values below the limit of detection were assigned a value of half the limit of detection. P values were derived from a two-sided unpaired Wilcoxon tests. Multiple testing correction was applied using the Benjamini-Hochberg method with an FDR < 0.05 deemed significant. Source data are provided as a Source Data file.

