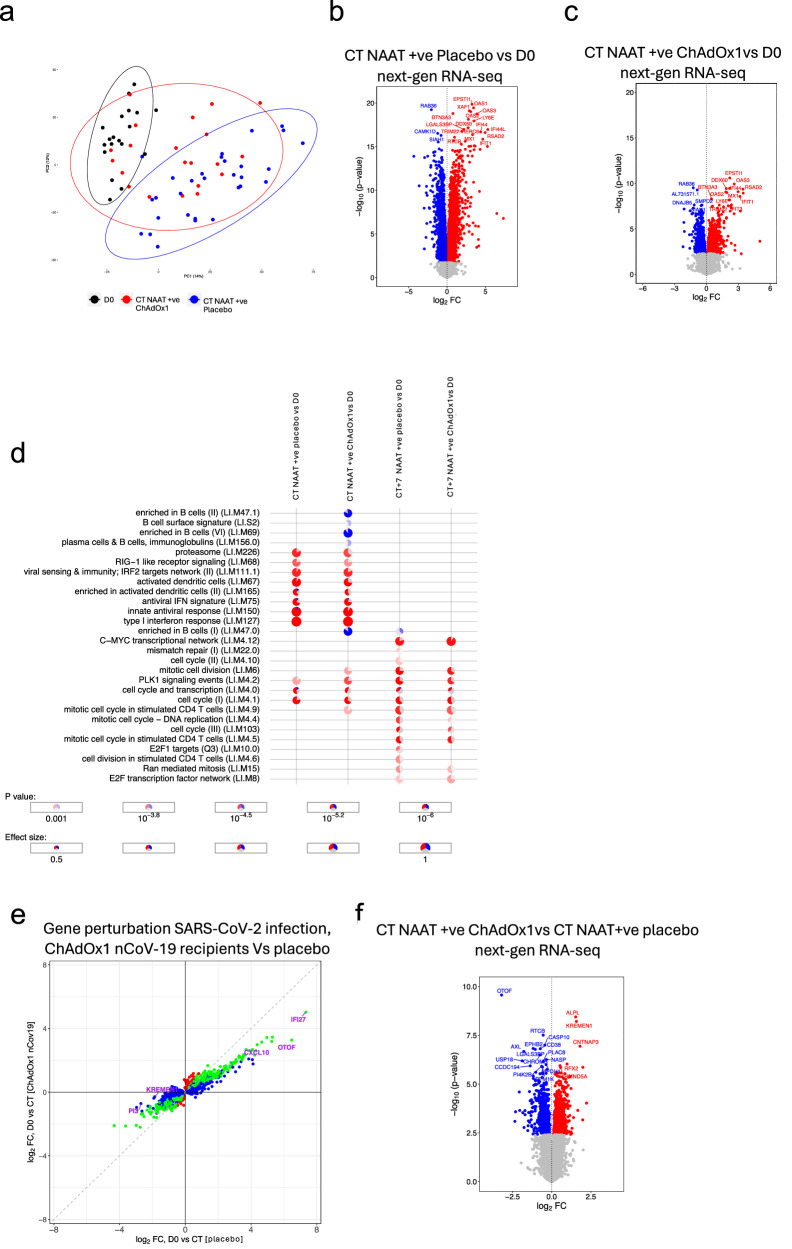
Fig. 5. Signatures of COVID-19 response from transcriptomics in larger cohort of NAAT+ participants.
a Principal component analysis of blood RNA-seq transcriptome (next-gen RNA-seq) of study participants before (D0, n = 19) and at the time of COVID-19 (CT NAAT+ve ChAdOx1 nCoV-19 n = 21, CT NAAT+ve placebo n = 30). b Volcano plot comparing the next-gen RNA-seq blood transcriptome at COVID-19 onset (CT NAAT+ve), placebo vaccinees (n = 30) compared with baseline (D0, n = 19) samples. Blue = downregulated at CT (FDR < 0.05), red = upregulated at CT (FDR < 0.05). Differential expression analysis was performed using a two-sided moderate t test. c Volcano plot comparing the next-gen RNA-seq blood transcriptome at COVID-19 onset (CT NAAT+ve) in ChAdOx1 nCoV-19 vaccinees (n = 21) compared with baseline (D0, n = 19) samples. Blue = downregulated at CT (FDR < 0.05), red = upregulated at CT(FDR < 0.05). Differential expression analysis was performed using a two-sided moderate t test. d Blood transcriptional modules (BTM) enriched during COVID-19 compared with baseline. Enriched BTMs (FDR < 0.001) are displayed. Segments of the pie charts represent the proportion of upregulated (red) and downregulated (blue) genes (absolute fold change >1.25). Enrichment P values were derived from a hypergeometric test, after adjustment for multiple testing (Benjamini and Hochberg’s method). e Agreement plot of differentially expressed genes at CT NAAT+ve in individuals in Placebo (x-axis, n = 30) and ChAdOx1 nCoV-19 (y-axis, n = 21) vaccine recipients compared with baseline (D0, n = 19). f Volcano plot comparing the next-gen RNA-seq blood transcriptome at CT NAAT+ve in individuals who received the ChAdOx1 nCoV-19 vaccine (n = 21) compared with individuals who received a placebo vaccine (n = 30). Blue = higher in placebo group (FDR < 0.05), red = higher in ChAdOx1 nCoV-19 group (FDR < 0.05). Differential expression analysis was performed using a two-sided moderate t test. Source data are provided as a Source Data file.

