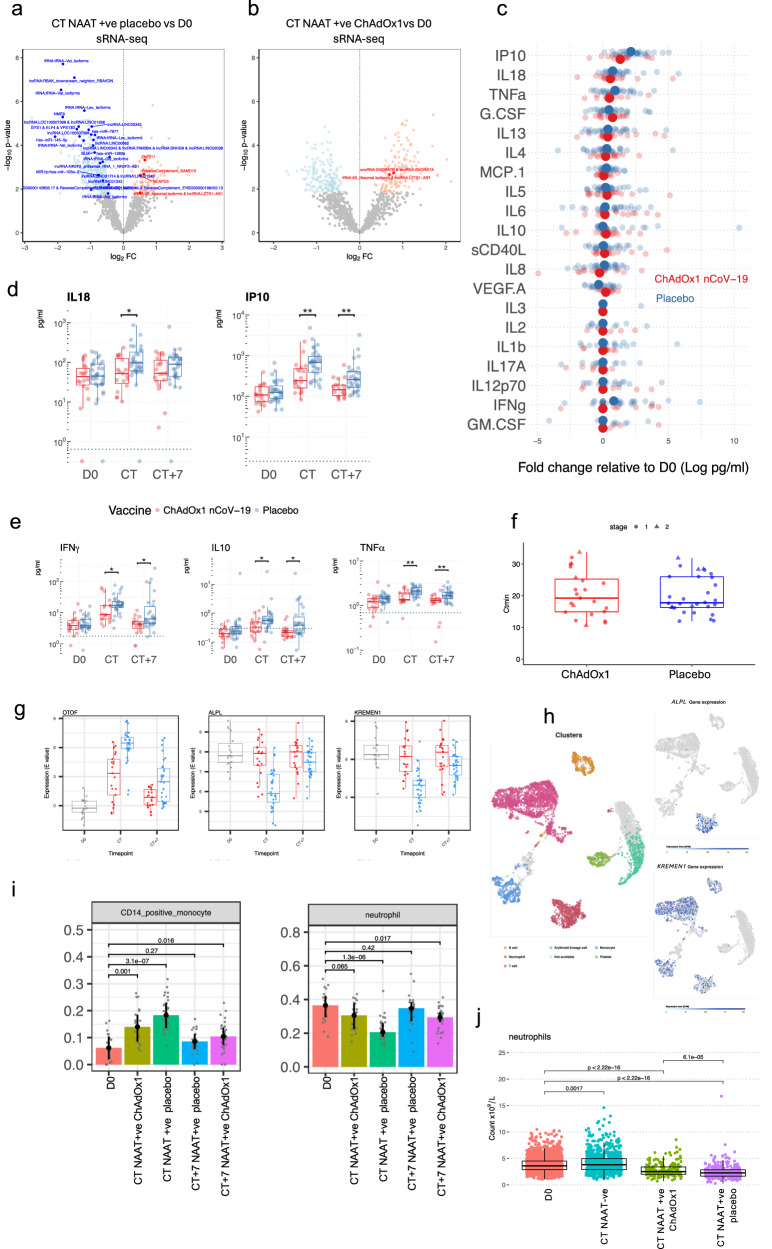
Fig. 6. Dissecting attenuation of the response in vaccines.
Volcano plot comparing the small RNA-seq blood transcriptome at CT NAAT+ve (placebo, n = 30) (a) and at CT NAAT+ve in ChAdOx1 nCoV-19 vaccinees (n = 21) (b) compared with baseline (D0, n = 19) samples (blue downregulated FDR < 0.05, red upregulated FDR < 0.05, bold p < 0.05 in stage 1 data). Differential expression analysis was performed using a two-sided moderate t test. Serum cytokine levels measured by Luminex (c, d) and MSD (e) in paired samples from NAAT+ve ChAdOx1-nCoV-19 (n = 18 D0, n = 19 CT and CT + 7, red) and NAAT+ve placebo (n = 31 D0 and CT, n = 30 CT + 7, blue). c Fold-change in cytokines at symptom onset relative to baseline. Solid dots represent mean fold-change, translucent dots represent individual volunteers. d, e Boxplots describing representative concentrations of cytokines. Statistical significance assessed based on FDR from two-sided unpaired Wilcoxon tests. Dashed line represents limit of detection. f Minimum cycle threshold (Ctmin) values of RT-PCR for the COVID-19 episode in placebo and ChAdOx1 nCoV-19 vaccine recipients, two-sided Wilcoxon test, p = 0.79 for stage 1 (ChAdOx1 nCoV-19 n = 5, placebo n = 6), p = 0.93 for stage 2 (ChAdOx1 nCoV-19 = 18, placebo n = 24); p = 0.93 overall. g Top three genes differentially regulated, by p value, during COVID-19 in ChAdOx1-nCoV-19 vaccinees (red, CT n = 21, CT + 7 n = 21) compared with placebo vaccine recipients (blue, CT n = 21, CT + 7 n = 31). h RNA-sequencing data from single cell expression atlas (https://www.ebi.ac.uk/gxa/sc/experiments/E-MTAB-9221/) showing clusters by cell identity and expression of ALPL and KREMEN1 in cell clusters. i Estimated cell abundance from RNA-seq data derived from CibersortX at baseline (D0, n = 19) and in NAAT+ve participants at CT (ChAdOx1 nCoV-19 n = 21, placebo n = 30) and CT + 7 (ChAdOx1 nCoV-19 n = 21, placebo n = 31). Bar denotes the median value. j Absolute neutrophil counts measured at baseline (n = 2276), and at CT in NAAT+ve (ChAdOx1 nCoV-19 vaccinees n = 190, placebo vaccinees n = 327) and NAAT-ve (n = 835) participants. Multiple testing applied in differential gene and protein analyses using the Benjamini-Hochberg method (*FDR < 0.05, **FDR < 0.01). Boxplot (d–g, j) boxes contain 25th to 75th percentiles of dataset, with central lines representing medians. Whiskers mark 1.5x the inter-quantile range (IQR). Each dot represents one volunteer. Source data are provided as a Source Data file.

