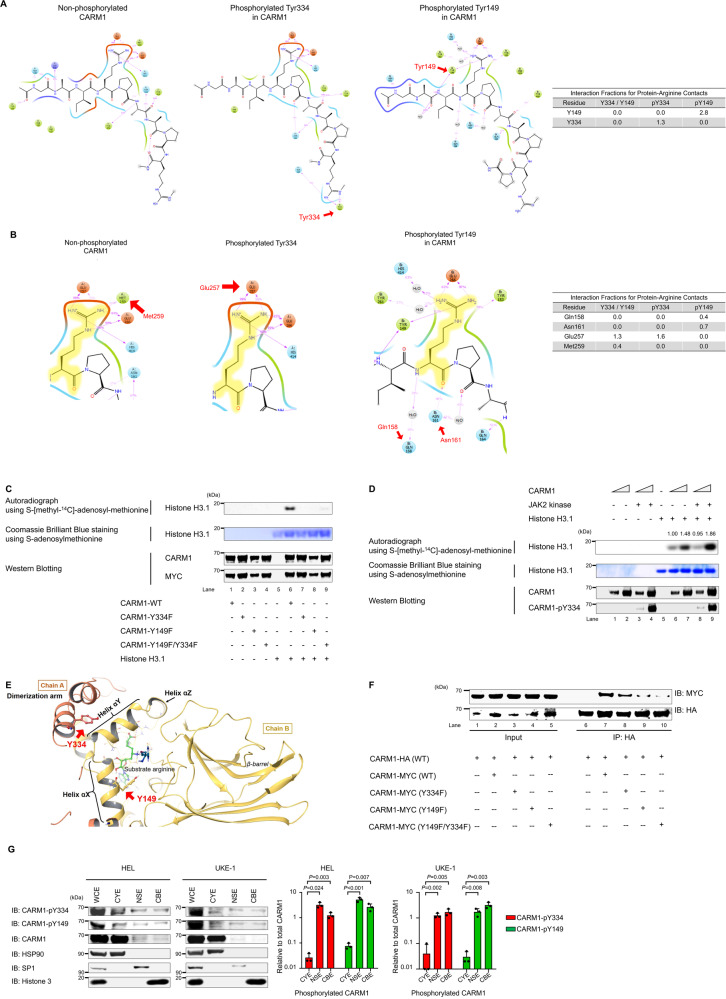
Fig. 3. Biochemical regulation of CARM1 enzymatic activity by tyrosine phosphorylation.
A Based on the crystal structures of CARM1, CARM1-Y334 phosphorylation (middle) increased the interaction of the region containing Y334 itself with the substrate compared with non-phosphorylated Y334 (left). CARM1-Y149 phosphorylation (right) also increased the binding of the region containing Y149 itself with the substrate. B CARM1-Y334 and -Y149 phosphorylation impairs the loss of binding between CARM1 methionine-259 (Met259) and substrate. The decreased Met259 binding increases the interaction of glutamic acid-257 (Glu257) and glutamic acid-266 (Glu266) with substrates (middle) in the presence of Y334 phosphorylation, compared to non-phosphorylated Y334 (left). Furthermore, the loss of methionine-259 binding increases the interaction of glutamine-158 (Gln158) and aspartic acid-161 (Asn161) with substrates in the presence of Y149 phosphorylation (right). C Immunoprecipitation was performed using an anti-MYC antibody and 293 T cells that express MYC-tagged WT or non-phosphorylatable CARM1. The mutant CARM1 Y149F, Y334F, and Y149F/Y334F proteins show reduced methyltransferase activity for histone H3.1, compared to wild-type (WT) CARM1, in in vitro methylation assay. CARM1 and MYC protein lanes are shown to demonstrate equal loading (Top). Autoradiograph of the methylated 3H-histone H3.1 (Middle). Coomassie staining shows histone H3.1 used in the assay (Bottom). Western blotting shows the relative amount of CARM1 and MYC. D Recombinant CARM1 protein (produced in E.coli), histone H3.1, and 14C-SAM were incubated to perform an in vitro methylation assay. CARM1 was also incubated with JAK2 kinase, leading to its phosphorylation on Y334 in lanes 3, 4, 7, and 8. Phosphorylated CARM1 shows increased methyltransferase activity for histone H3.1 in in vitro methylation assay (Top). Autoradiograph of the methylated 3H-histone H3.1 (Middle). Coomassie staining shows histone H3.1 used in the assay (Bottom). Western blotting shows the relative amount of CARM1 and phosphorylated CARM1. E CARM1-Y149 and -Y334 localize at dimerization arm and helix αX, respectively. These residues lie close to the dimerization interface in the modeled CARM1 structure. F Co-immunoprecipitation of HA- and MYC-tagged CARM1 from 293 T cell extracts transiently transfected with plasmid expressing HA-tagged WT and MYC-tagged WT or mutant CARM1. HA-tagged WT CARM1 was immunoprecipitated from cell extracts with anti-HA antibodies, and then the coimmunoprecipitated MYC-tagged CARM1 was probed with anti-MYC antibodies. The levels of MYC-tagged CARM1 Y149F and Y149F/Y334F from the HA immunoprecipitates were lower than those of MYC-tagged CARM1 WT. G Subcellular fractionations of HEL cells and UKE-1 cells were immunoblotted using anti-total CARM1, CARM1-pY334, and -pY149 antibodies; cytoplasmic extraction, CYE; nuclear soluble extraction, NSE; and chromatin-bound extraction, CBE. The left lane represents the expression levels of the indicated proteins of whole-cell lysates (WCE). The bar graph on the right represents the ratio of cytoplasmic, nuclear, or chromatin-binding CARM1-pY334 and -pY149 to total cytoplasmic, nuclear, or chromatin-binding CARM1, respectively (bands inside the boxes). Data represent the mean ± SD. n = 3, unpaired two-tailed Student’s t-test. C, D, F All experiments were repeated two times independently.

