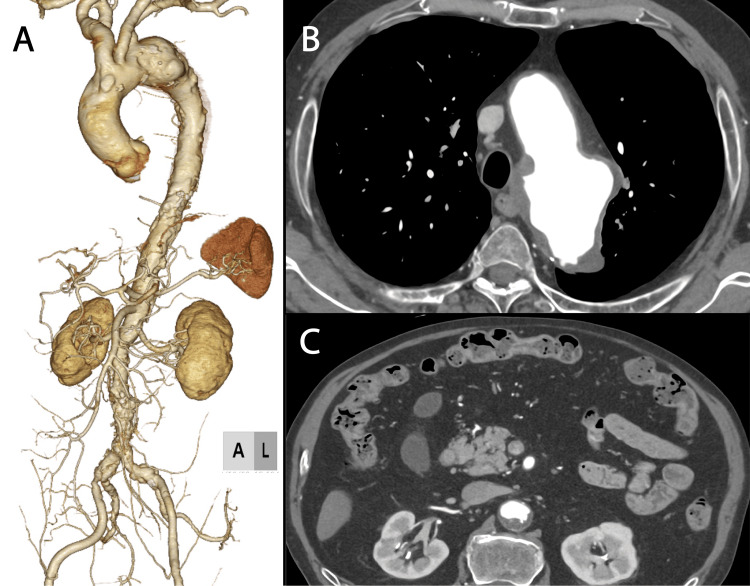
Figure 1. Computed tomography imaging before operation.
(A) Volume rendering image. The aortic arch aneurysm diameter was 60 mm. (B) Axial image at the aortic arch showed high atherosclerosis changes. (C) Axial image at the pancreas level indicated highly atherosclerotic changes in the aorta and normal pancreas.

