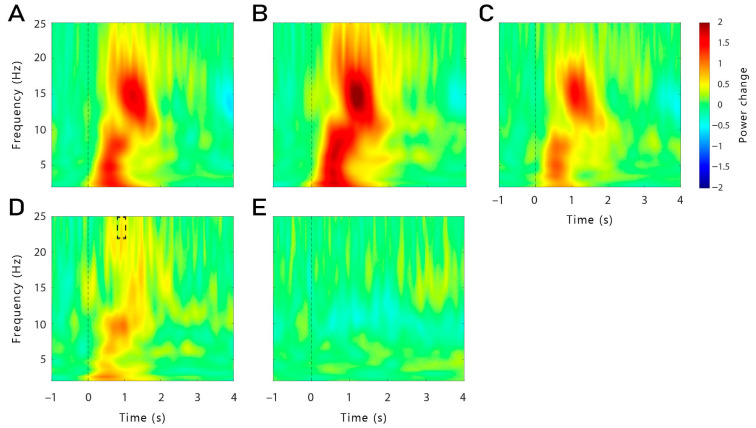
Figure 2.
Averaged oscillatory responses to words presented during non-REM sleep recorded in all channels (F3, F4, P3, P4, F7, F8, Fz, FC5, FC6, CP1, CP2, CP5, CP6, Pz). (A) Oscillatory power changes for all words (Hits, Misses) presented during non-REM sleep in both groups (continuous, time-locked). Word presentation during sleep led to the typical brain response encompassing an increase in the slow-wave activity (SWA), theta, and alpha bands (1–12 Hz), followed by an increase in the spindle and beta frequency bands (11–25 Hz). A similar pattern was observed in both groups individually, as shown in (B) for the continuous group and in (C) for the time-locked group. (D) Comparison of the oscillatory power changes between the continuous and the time-locked group: when comparing the general response between both groups, a higher beta power (21–25 Hz) was found in the continuous group, 0.89–1.09 s after cue onset, in the frontal regions (F3, F4, F7, F8, Fz, FC5, FC6; p = 0.028), as illustrated with the black dashed box. (E) Comparison of the oscillatory power changes between Hits and Misses combined for all conditions and groups: no difference was found.

