Figure 3.
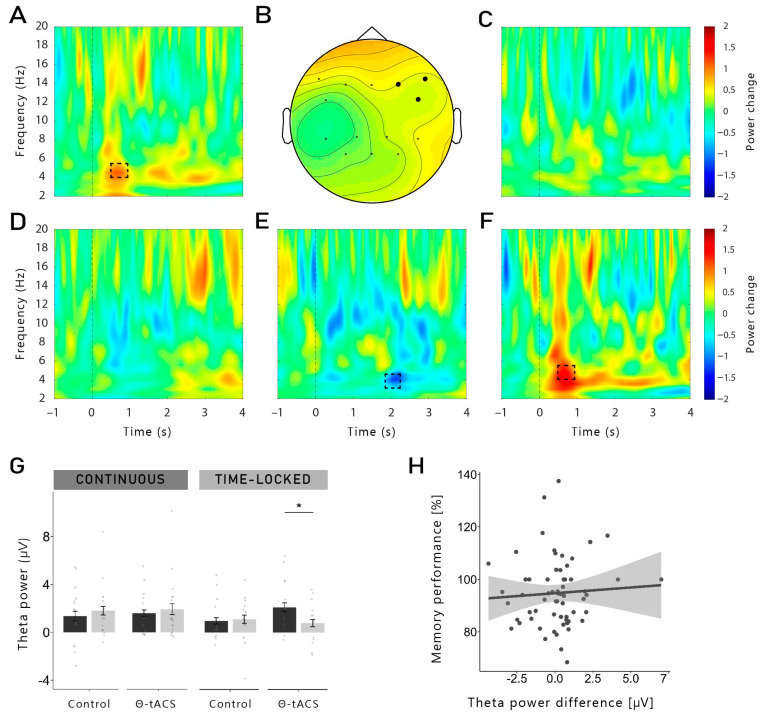
Averaged oscillatory differences between Hits and Misses: (A) In the time-locked group, a higher theta power (5 Hz) was observed for theta-Hits (compared to theta-Misses) 550–800 ms after stimulus onset (p = 0.044). The dashed box indicates the time (550–800 ms)-frequency (5–5.5 Hz) area used to illustrate the topographical distribution shown in subfigure (B). Significant electrodes are represented in filled black dots. (C) This cluster was found neither in the control-tACS of the time-locked group nor in the continuous group in both (D) the theta-tACS condition and (E) the control condition. (E) Control-Hits vs. control-Misses in the continuous group: there was a statistical trend for a lower theta power for Hits, 1.92–2.26 s after cue onset in the control-tACS condition, in the frontal region (p = 0.079). (F) Theta-Hits vs. theta-Misses in the time-locked group, in the frontal right region: the cluster shown in (A) was observed specifically in the frontal right region (F4, F8, FC6; p = 0.012) of the theta-tACS condition in the time-locked group. (G) Mean theta power from the cluster shown in (F): exploratory t-tests on the extracted mean theta power in this time window in the right frontal region revealed that theta power was indeed higher for Hits compared to Misses in the theta-tACS condition of the time-locked group (t14 = −2.71, p = 0.017, d = 0.70), but not in the continuous group, nor in the control-tACS condition (all p-value > 0.284). (H) Correlation between theta power difference between Hits and Misses in the frontal right region and memory performance, both groups and stimulation conditions together: no correlation was found. The shaded area represents 95% confidence interval. *: p < 0.05.

