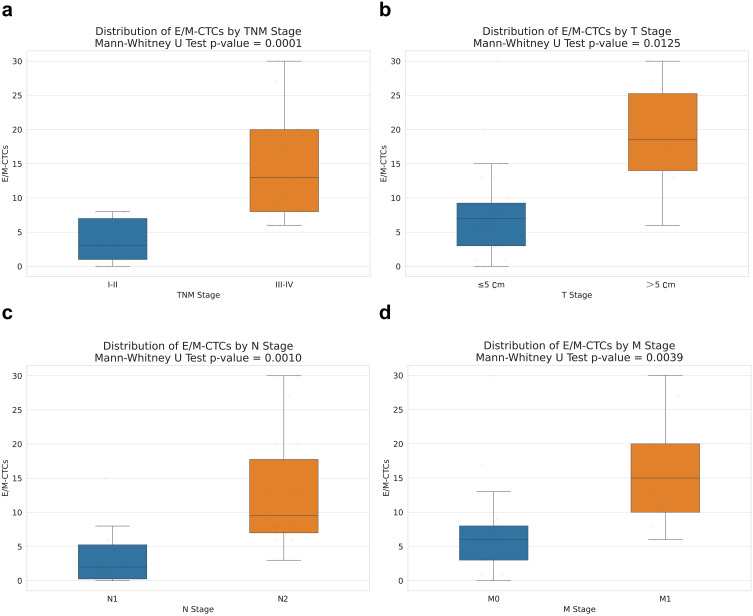
Figure 3.
Association Analysis of E/M-CTCs Distribution with Clinical Staging Variables.
Notes: (a) The figure shows the distribution of E/M-CTCs in two different TNM stage groups (I–II and III–IV). (b) The figure shows the distribution of E/M-CTCs in two different T stage groups (≤5cm and >5cm). (c) The figure shows the distribution of E/M-CTCs in two different N stage groups (“no” and “yes”). (d) The figure shows the distribution of E/M-CTCs in two different M stage groups (M0 and M1). Each box represents the interquartile range (IQR), and the individual scattered points represent the individual observations.

