
FIGURE 2.
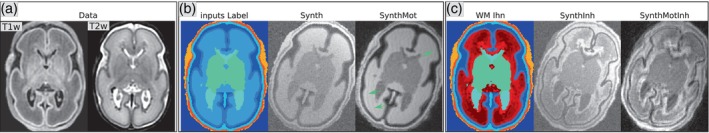
Illustration of the synthetic datasets obtained from one individual data. (a) The T1w and T2w MRI data from this subject; (b) and (c) show respectively the two different label maps (in color) used as input of the generative model (without and with additional labels in the WM to simulate inhomogeneities). For each label map, we show an illustrative example of augmented synthetic images, corresponding to the four synthesis‐based models. Green arrows indicate subtle artifacts induced by motion simulation.