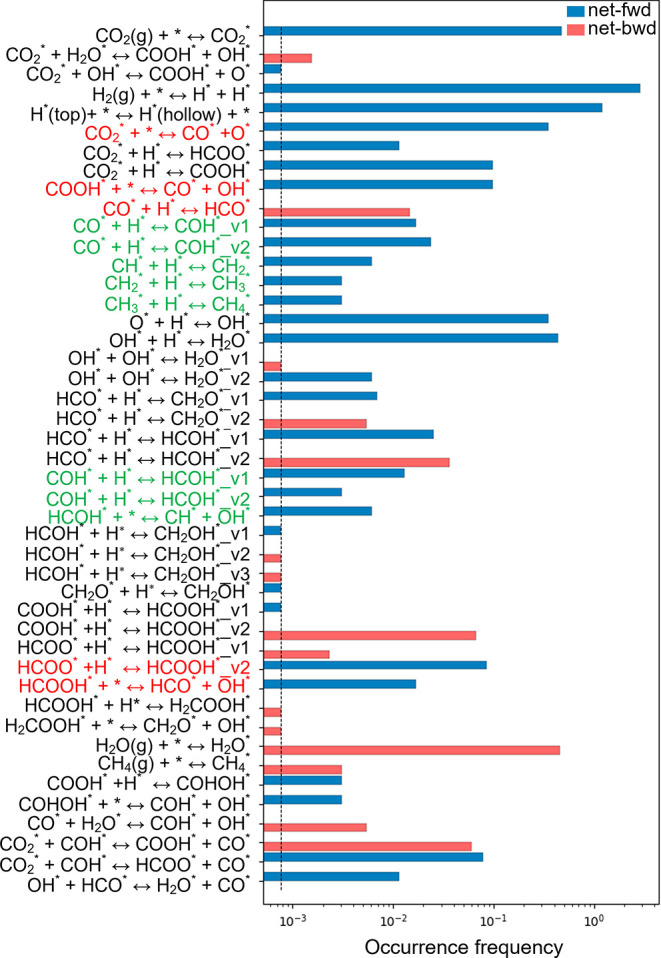
Figure 6.

Occurrence frequency of the elementary steps (excluding events with zero frequency) during the time interval of 0–1300 s at a temperature of 473.15 K and a pressure of 1 bar (PH2 = 0.8 bar, PCO2 = 0.2 bar). Net rates of the reversible events are calculated by subtracting the reverse rates from the forward rates. The positive net rates are denoted as “net-fwd”, while the negative ones are labeled as “net-bwd”. Pathways for the RWGS reaction are highlighted in red, while pathways leading to methane formation are marked in green. Labels v1 and v2 represent the sets of neighboring sites with different types of site connectivity defined in kMC simulations, on which the same elementary process takes place.
