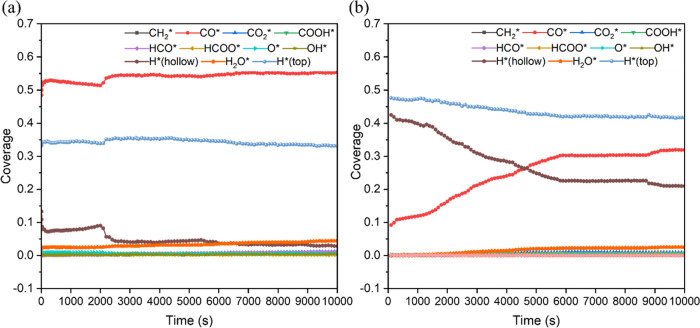
Figure 8.
Evolution of the coverages of surface species over time at the temperatures of (a) 573.15 K and (b) 473.15 K, with a pressure of 1 bar (PH2 = 0.8 bar, PCO2 = 0.2 bar). Herein, the coverage is defined as the fraction of a specific surface species over the total species, independent of the number of the sites, since the different types of active sites are occupied by the multidentate species.

