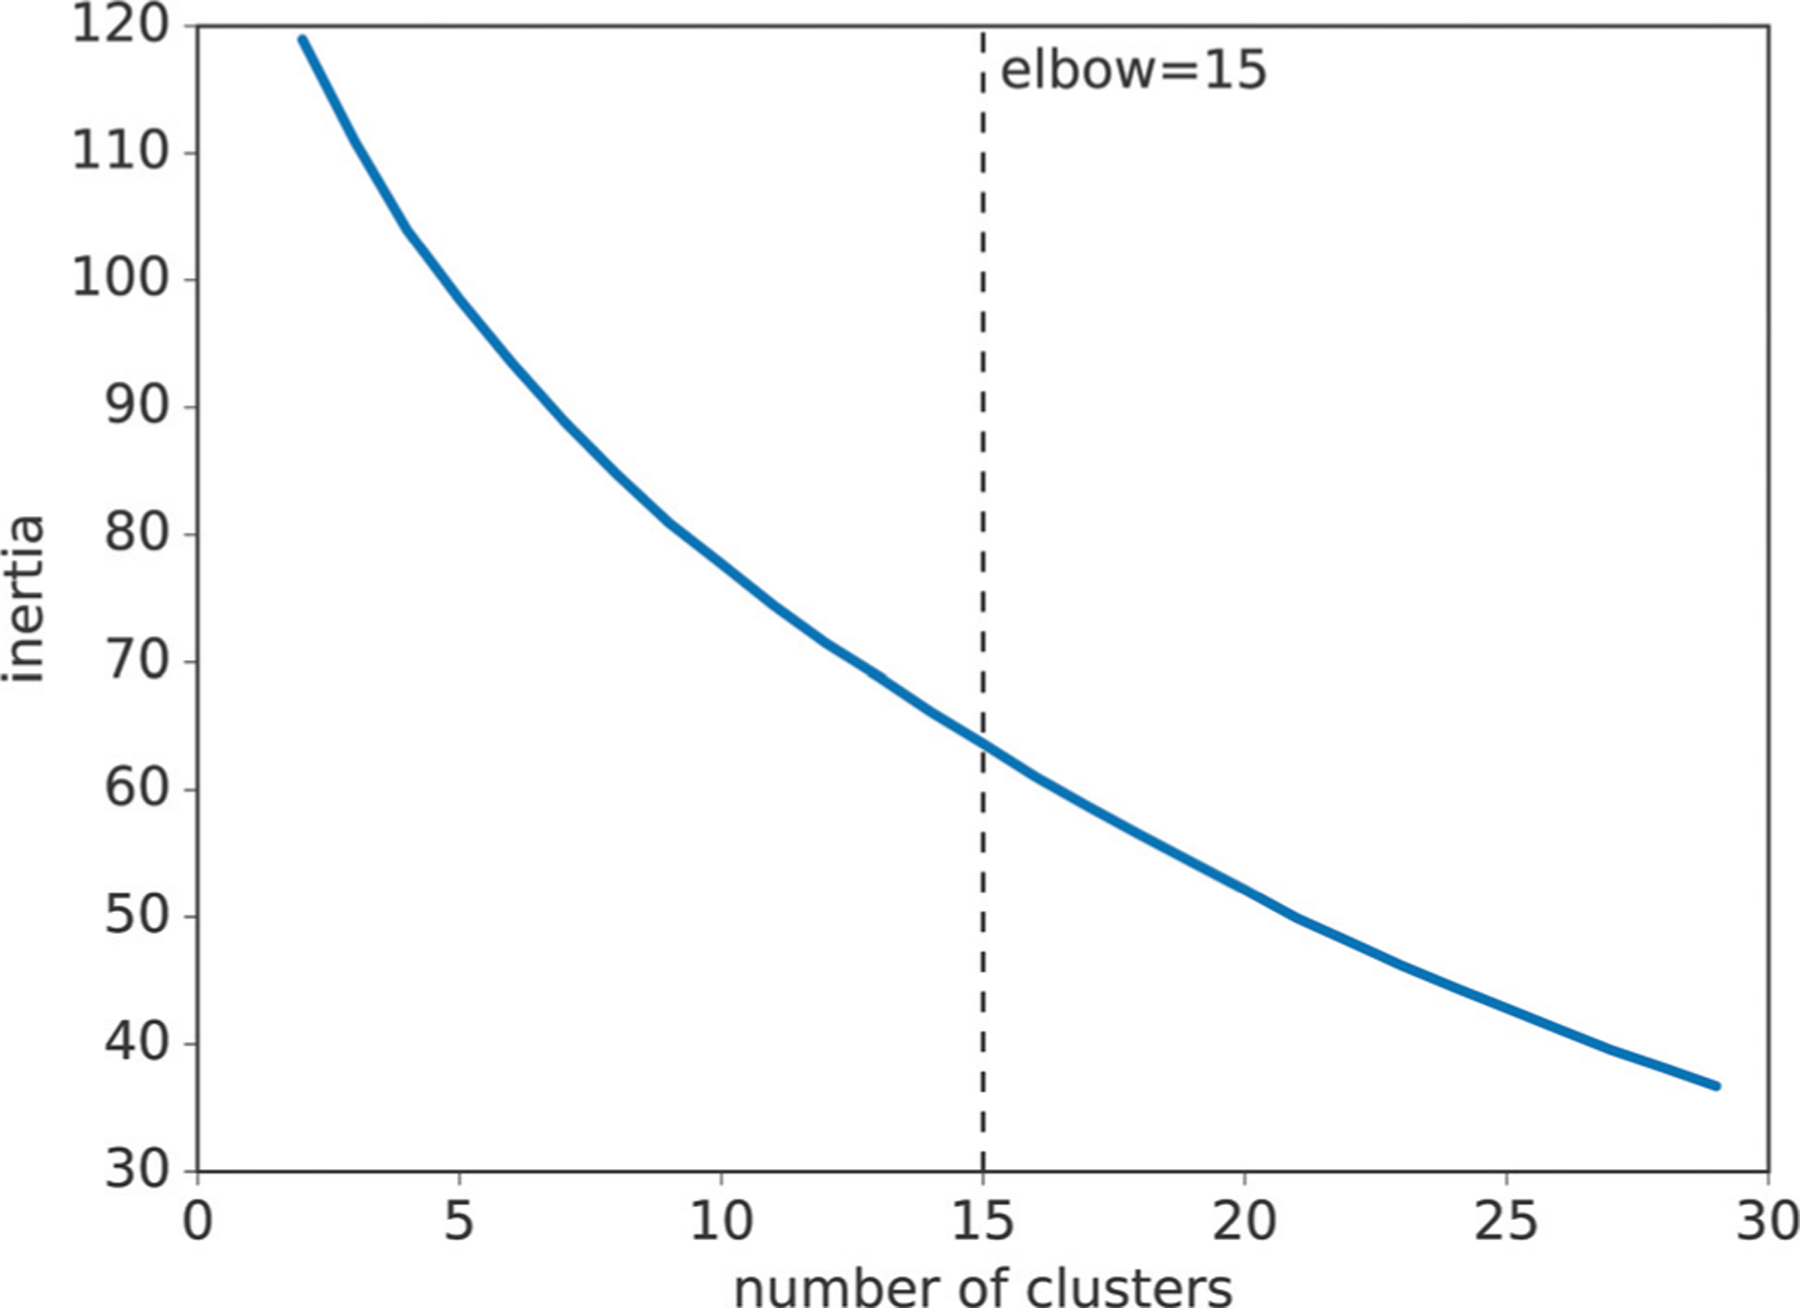
Fig. 2.

Assessment of cluster numbers. The x-axis corresponds to the number of clusters and the y-axis corresponds to the mean inertia of 100 cluster results with the given number of clusters. The Kneedle algorithm established an optimal number of 15 (15.35 ± 2.67) clusters across 100 cluster results.
