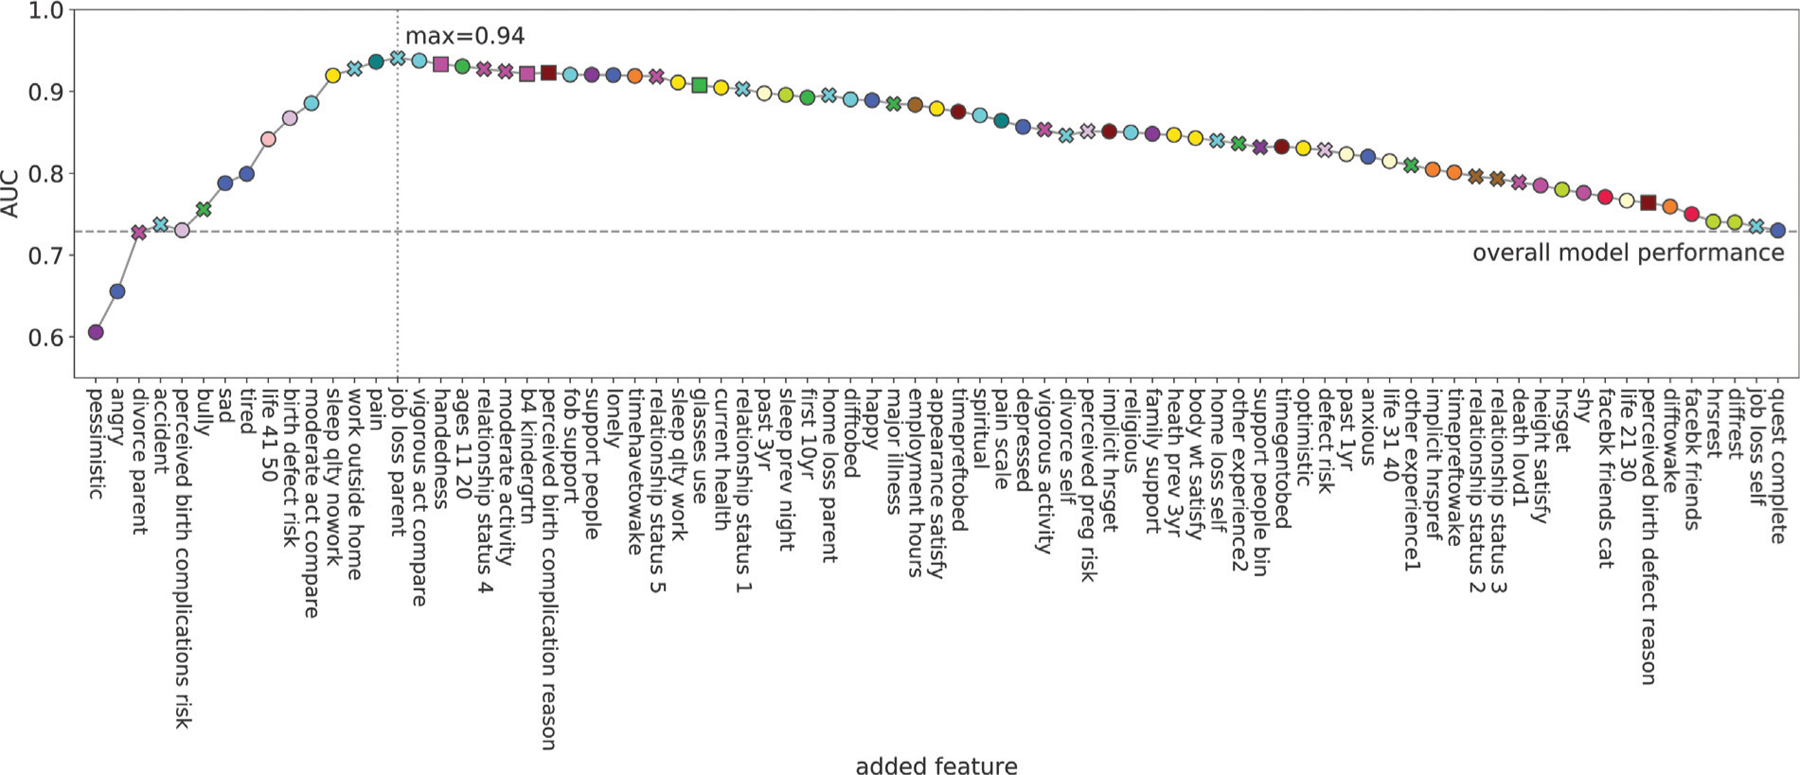
Fig. 7.

Model reduction trace based on forward selection. The x-axis shows the order of added variables from the model with the least features on the left and most features on the right. The y-axis shows the mean AUC value of the corresponding model for predicting preterm birth. The colors of the markers correspond to the cluster the variable is associated with. The shape corresponds to the type of the variable (round: ordinal or numeric, x: binary, and square categorical). The most predictive model includes the variables from “pessimistic” to “job loss parent” making these variables important candidates for future studies. Furthermore, the model including only the features “pessimistic,” “angry,” “divorce parent” yields an AUC close to the overall model indicating the importance and predictive power of this particular combination of variables. AUC, area under the receiver operating characteristic curve.
