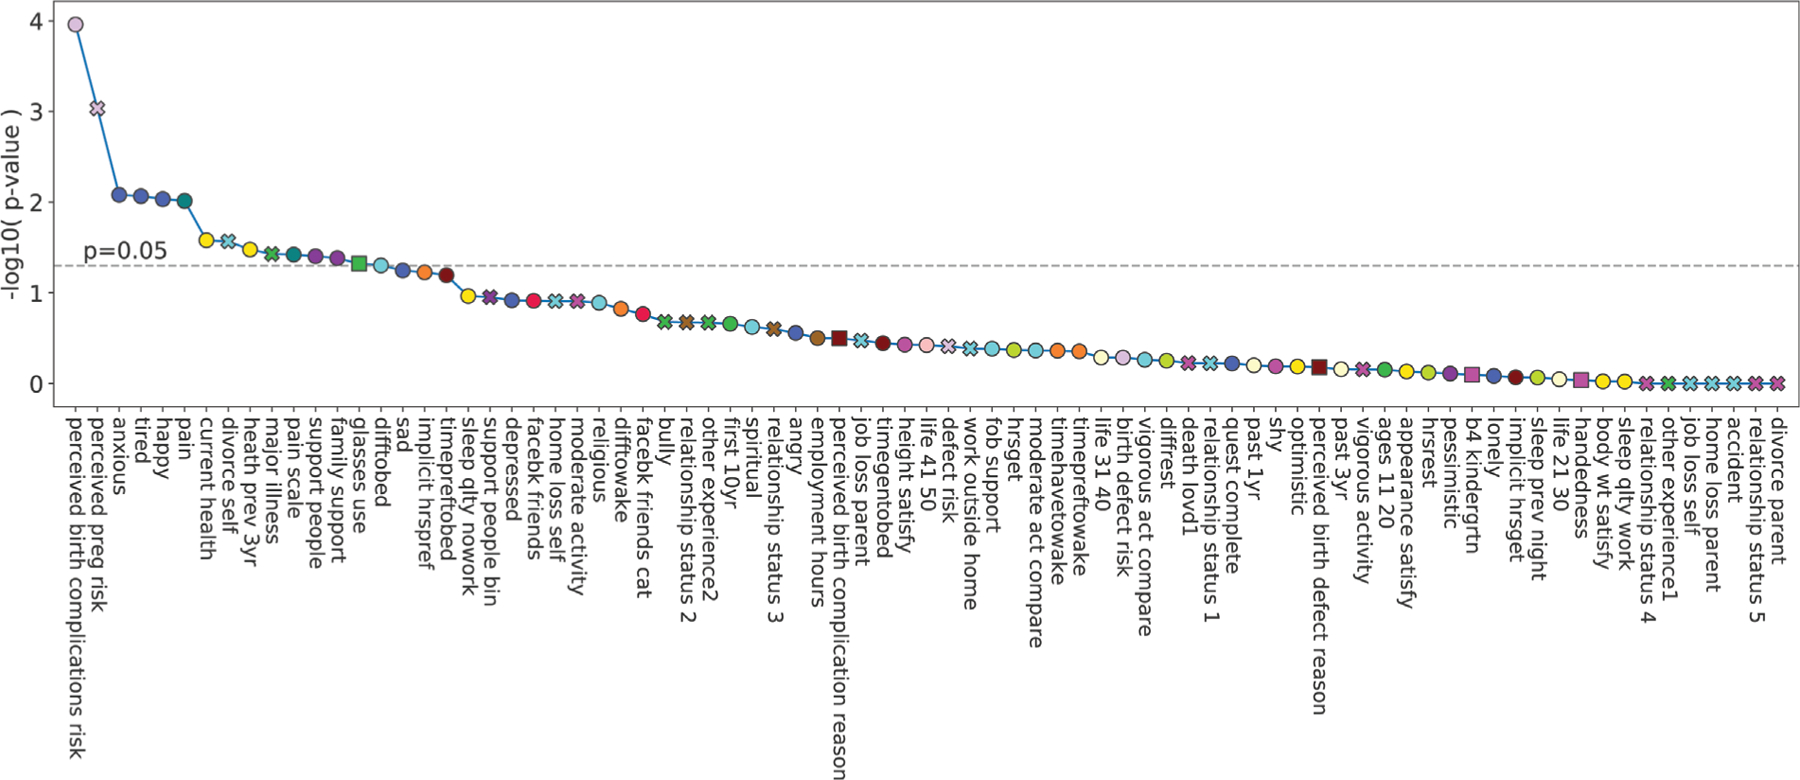
Fig. 8.

Variable association with preterm birth. The x-axis shows all variables ordered according to decreasing statistical strength with regard to their association with gestational age at delivery (see IDP for details on the corresponding tests). The y-axis represents the negative log10 p-value of these associations (not corrected with regard to multiple hypothesis comparison). The colors of the markers correspond to the cluster the variable is associated with. The shape corresponds to the type of the variable (round: ordinal or numeric, x: binary, and square categorical). Note that several of the highly associated variables are identified as important variables in our forward selection procedure in ►Fig. 7 (e.g., perceived risk of birth complications, tired, pain, sad). IDP, interdependency.
