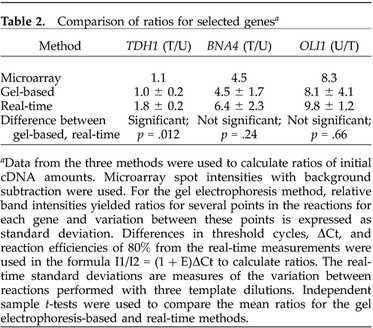
Table 2. Comparison of ratios for selected genesa.

aData from the three methods were used to calculate ratios of initial cDNA amounts. Microarray spot intensities with background subtraction were used. For the gel electrophoresis method, relative band intensities yielded ratios for several points in the reactions for each gene and variation between these points is expressed as standard deviation. Differences in threshold cycles, ΔCt, and reaction efficiencies of 80% from the real-time measurements were used in the formula I1/I2 = (1 + E)ΔCt to calculate ratios. The real-time standard deviations are measures of the variation between reactions performed with three template dilutions. Independent sample t-tests were used to compare the mean ratios for the gel electrophoresis-based and real-time methods
