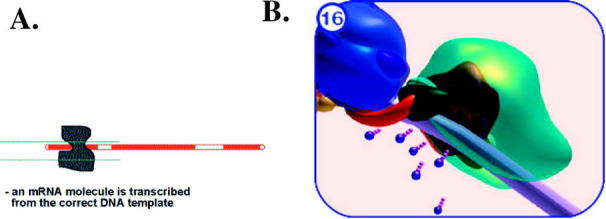
Figure 4.

A comparison of a flat 2D (A) and a 3D (B) representation of the same set in the mRNA transcription process. These are 1997 (A) and 2003 (B) vintage graphics from the WWWIC Virtual Cell animation project and presented to show the level of sophistication new software tools offer.
