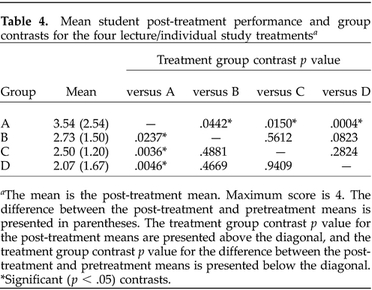
Table 4. Mean student post-treatment performance and group contrasts for the four lecture/individual study treatmentsa.

aThe mean is the post-treatment mean. Maximum score is 4. The difference between the post-treatment and pretreatment means is presented in parentheses. The treatment group contrast p value for the post-treatment means are presented above the diagonal, and the treatment group contrast p value for the difference between the post-treatment and pretreatment means is presented below the diagonal. *Significant (p < .05) contrasts
