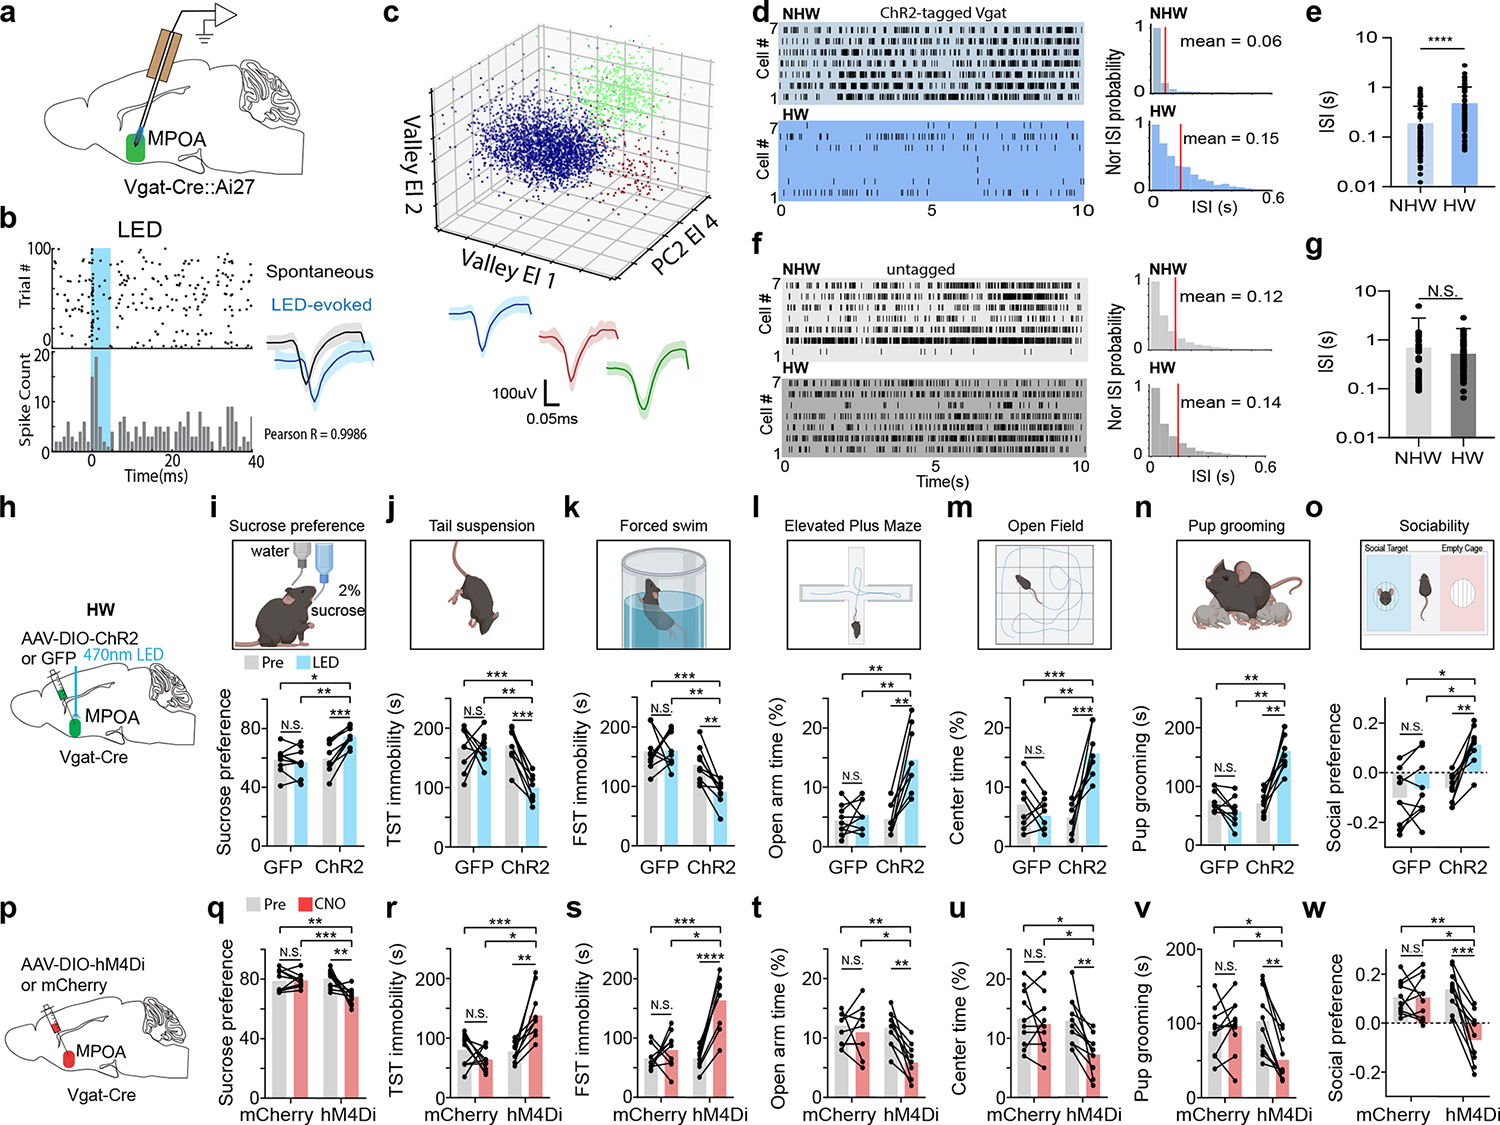
Fig. 1. MPOA GABAergic activity is modulated by hormone withdrawal and correlated with depressive-like phenotypes.

a, Schematic of optrode recording in MPOA of a female Vgat-Cre crossed with Cre-dependent ChR2 mouse. b, Left, raster plot (upper) and peristimulus spike time histogram (PSTH, lower) for spikes evoked by a LED light pulse (blue shade) in a ChR2-tagged cell. Right, similarity between spontaneous and LED-evoked spikes of the same unit. Blue band represents 5ms LED stimulation. c, Example spike sorting. Different colors label different units. Bottom, average spike shapes of three units. d, Left, raster plots of spontaneous spikes of seven ChR2-tagged neurons in NHW-control and HW-treated groups. Right, distribution of inter-spike-interval (ISI) for example cells. e, Mean ISIs of all the recorded ChR2-tagged cells in NHW-control and HW-treated groups (n = 87 and 74 cells respectively, from 3 animals in each group). ****P < 0.0001, two-tailed t-test. Error bar, s.d. f-g, ISI analysis for untagged cells (n = 80 cells for NHW and 96 cells for HW, 3 animals in each group). N.S., P = 0.4455, two-tailed t-test. Error bar, s.d. h, Schematic of viral injection and photo-stimulation of MPOA Vgat+ neurons. i, Percentage sucrose water consumption in SPT with (blue) and without (grey) photo-stimulation in ChR2- or GFP-expressing HW-treated animals. j, Immobility time in TST. k, Immobility time in FST. l, Percentage time spent in open arms in EPM test. m, Percentage time spent in the center in OFT. n, Total time of pup grooming. o, Social preference index (difference in time between two chambers divided by the total time) in the sociability test. i-o, n = 9 animals for each group. p-w, Similar to h-o but for chemogenetic silencing of MPOA Vgat+ neurons in normal female Vgat-Cre animals. n = 10 animals for each group. Statistics for i-w, *P < 0.05, **P < 0.01, ***P < 0.001, ****P < 0.0001, two-way repeated measures ANOVA test with multiple comparisons. For exact P values, see Figure 1 Source Data.
