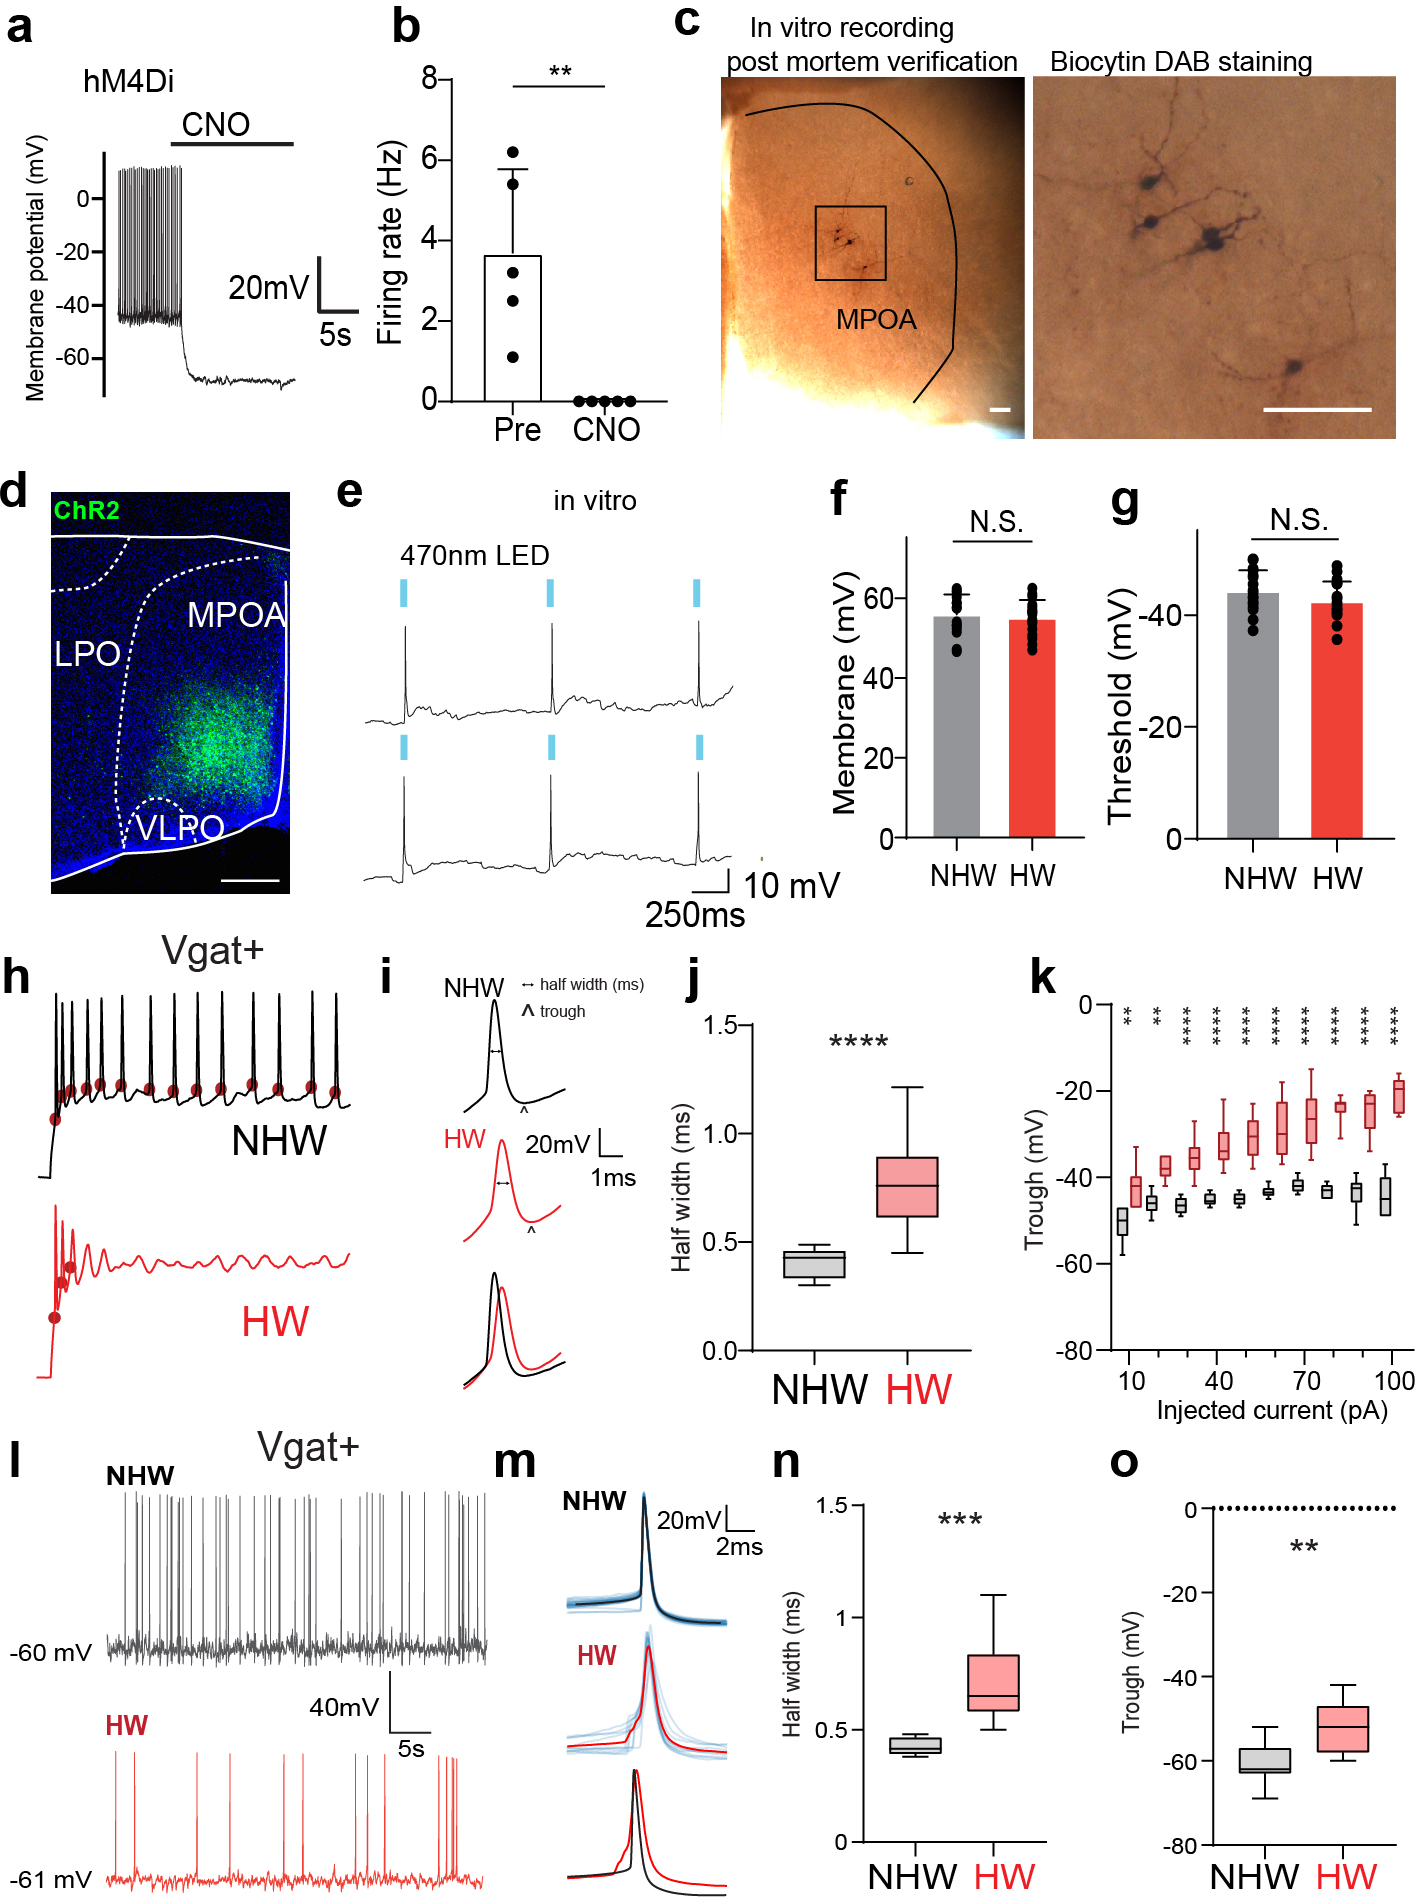
Extended Data Fig. 3. Functional verification of chemogenetics and optogenetics approaches, slice whole-cell recording and spike features.

a, Membrane hyperpolarization in response to perfusion of CNO in an example cell. Whole-cell recording was performed in DREADD receptor expressing Vgat+ neurons in MPOA (labeled by mCherry). b, Spontaneous firing rates before and after perfusion of CNO. **P = 0.0079, Two-tailed Mann-Whitney test. n=5 cells from 2 animals. c, Images showing the morphology of recorded MPOA neurons after biocytin staining. Scale bar, 100 μm. d, An example image showing the expression of ChR2 in MPOA, Scale bar, 400 μm. e, Slice whole-cell recording from a ChR2-expressing neuron showing action potentials evoked by 470nm LED light pulses (marked by blue bars). f, Average resting membrane potentials of MPOA Vgat+ neurons in NHW and HW slices. N.S., P = 0.5689, Two-tailed Mann-Whitney test. g, Action potential threshold of MPOA Vgat+ neurons in NHW and HW slices. N.S., P = 0.1309, Two-tailed Mann-Whitney test. f-g, n = 17 and 17 cells for NHW and HW respectively, from 4 animals in each group. Error bar, s.d. h, Example traces of membrane potential response to 60pA current injection in MPOA Vgat+ neurons. Red dot marks the onset of action potential. i, Example spike shapes (2nd evoked spikes). Scale bar, 20mV, 2ms. The horizontal dotted line indicates the half-peak width of the spike and the arrow marks the trough voltage. j, Average half-peak spike width of MPOA Vgat+ neurons in NHW and HW slices. n = 14 cells from 4 animals. ****P < 0.0001, Two-tailed Mann-Whitney test. k, Average trough voltage at different injection current amplitudes. n=14 cells from 4 animals. **P <0.01; ****P <0.0001, two-way repeated measures ANOVA, for exact P values see Extended Data Table 1. l, Example traces of spontaneous spikes of MPOA Vgat+ neurons in NHW and HW slices. m, Average spike shapes (solid color) of MPOA Vgat+ neurons. Light colors label individual spikes. n, Average half-peak spike width of spontaneous spikes of MPOA Vgat+ neurons in NHW and HW slices. n=8 cells from 4 animals. ***P = 0.0002, Two-tailed Mann-Whitney test. o, Average trough voltage of spontaneous spikes. n=11 cells from 4 animals. **P = 0.0015, Two-tailed Mann-Whitney test. For boxplot, centerline, mean, upper and lower end, 90 and 10 percentile.
