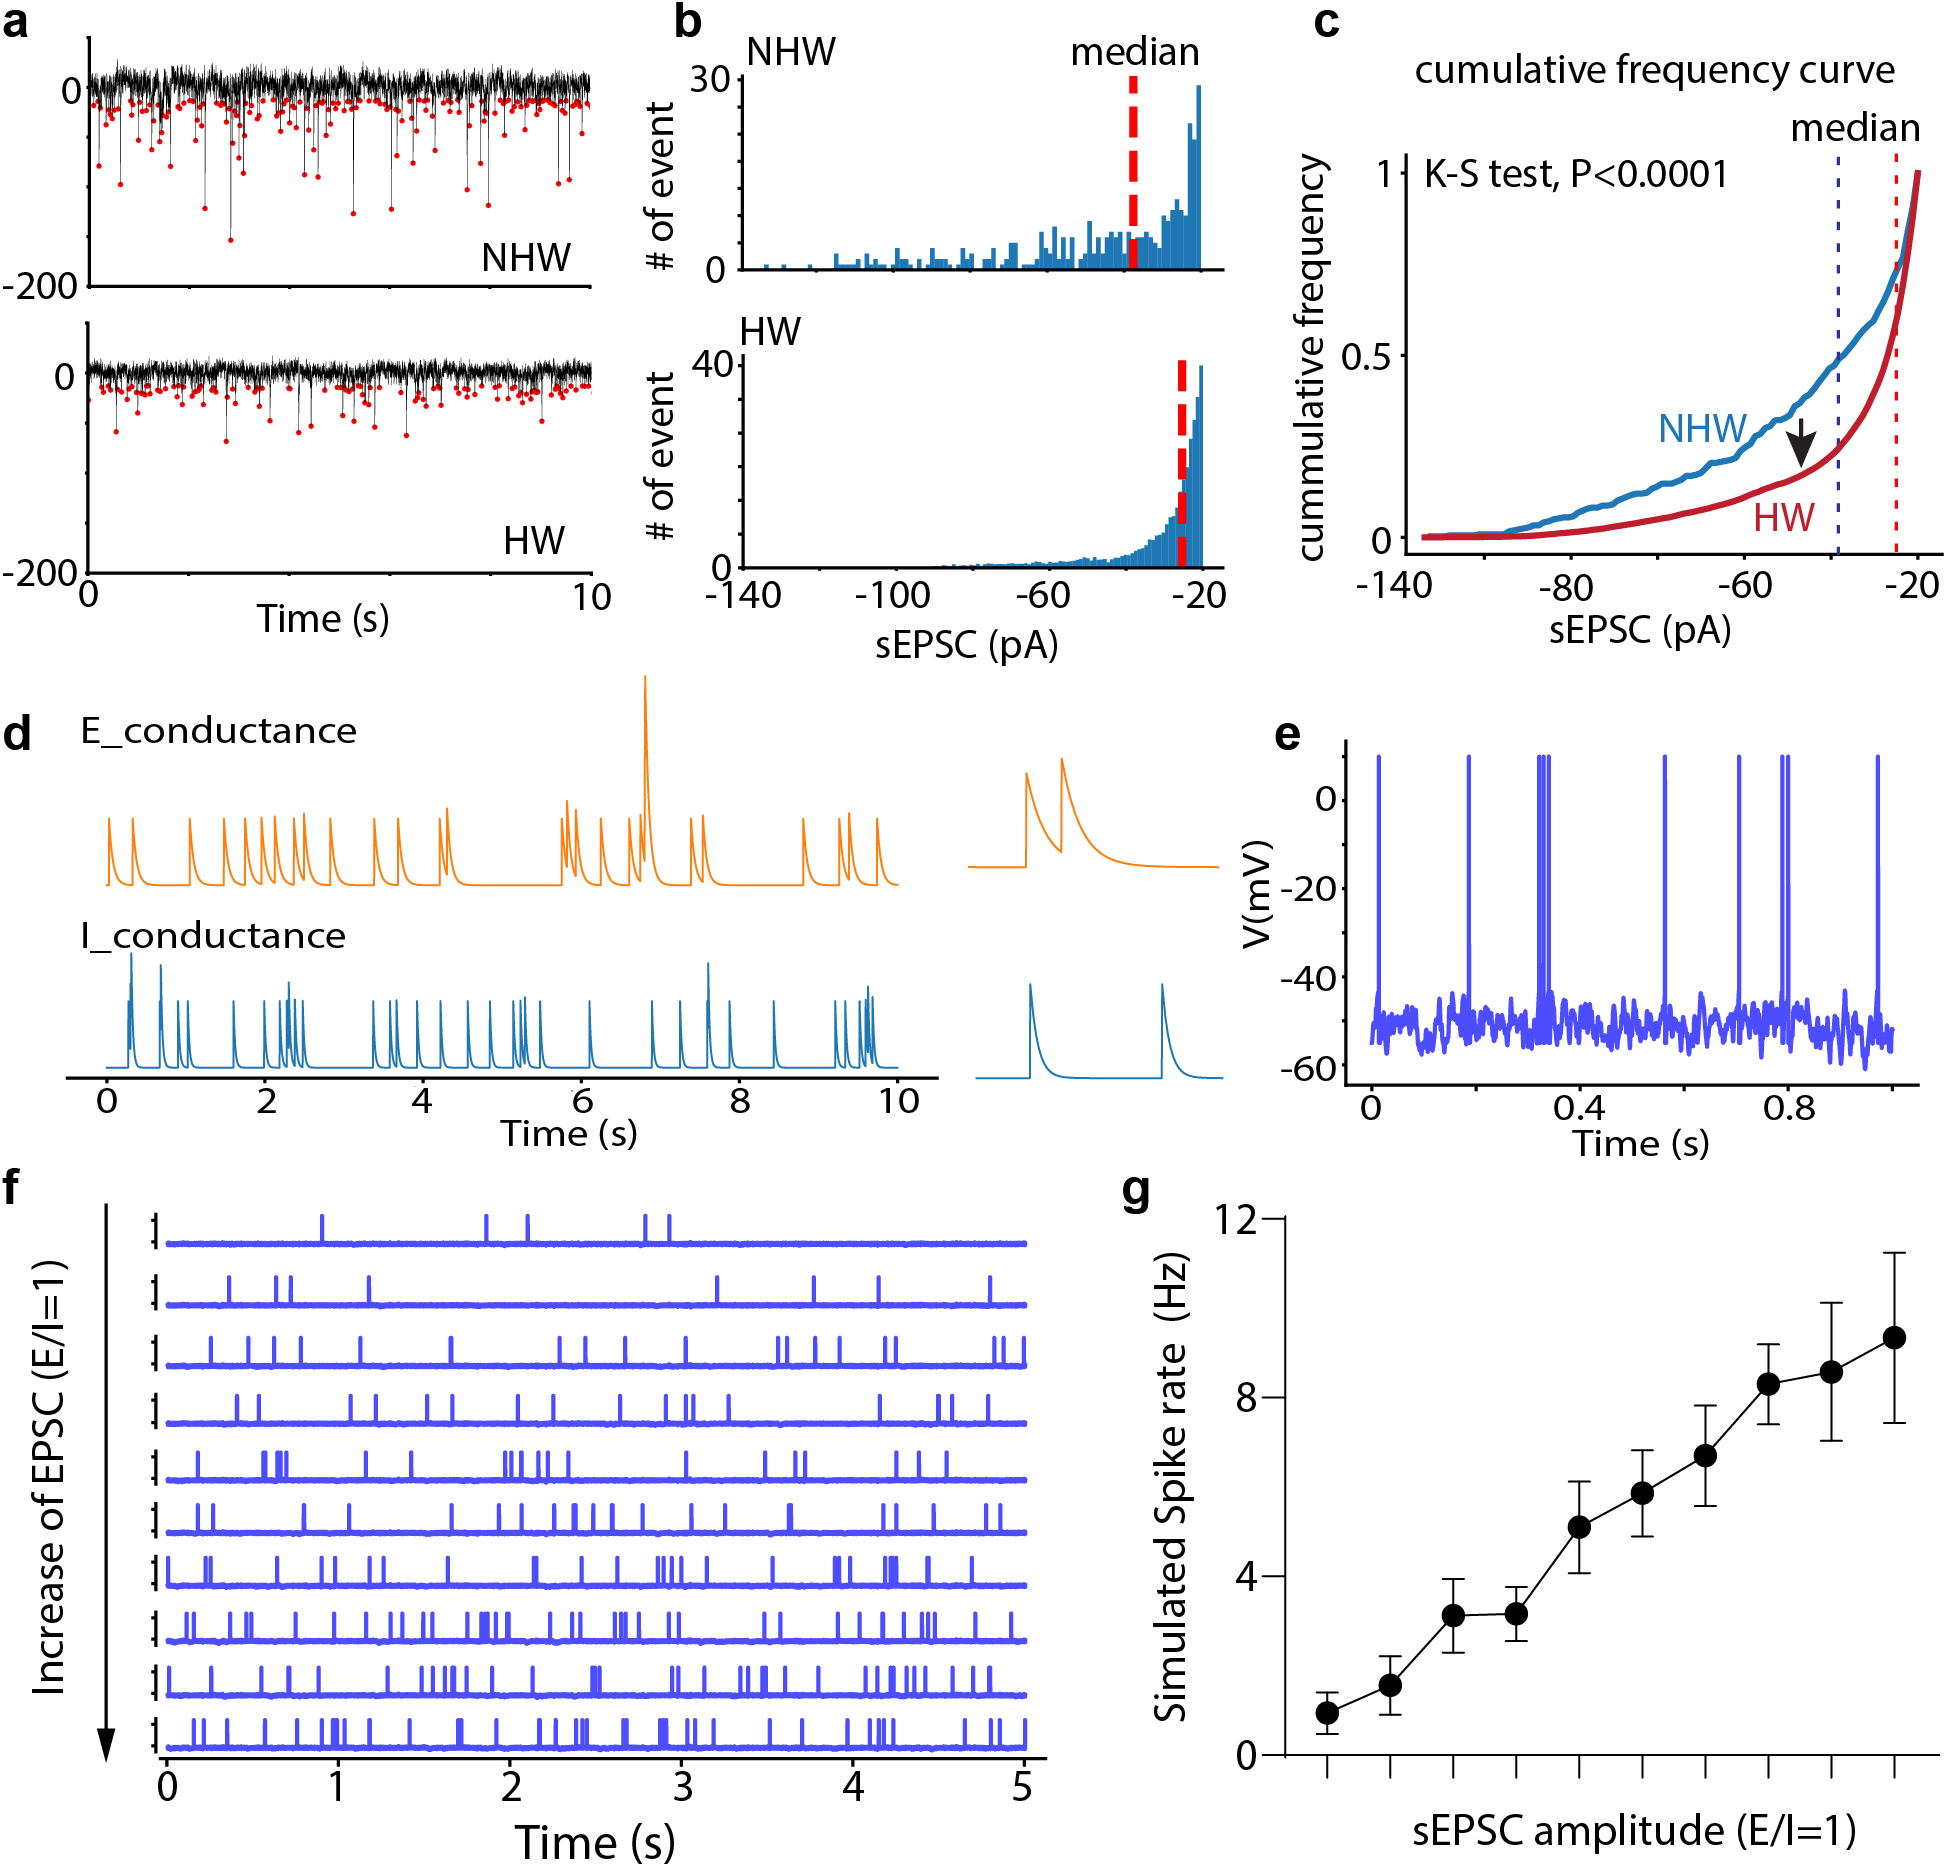
Extended Data Fig. 4. Changes in sEPSC frequency and effects of changes in synaptic event amplitude on spike rate.

a, Example sEPSC events within a 10-sec window, red dot indicates the peak. b, Distribution of sEPSC amplitudes shown in (a), red dashed line represents the median value. c, Cumulative distribution of sEPSC amplitudes shown in (a). P<0.0001, two-tailed K-S test. d, Simulated conductances of spontaneous excitatory and inhibitory events. e, Spikes generated from integrating spontaneous excitatory and inhibitory events using the leaky integrate-and-fire neuron model (see Methods). f, Raster plots of spontaneous spikes with increasing excitatory synaptic strength, with a constant overall E/I ratio. g, Simulated spike rate versus the mean amplitude of sEPSCs. Note that the E/I ratio was kept the same. n = 10 trials, error bar represents s.d..
