
Extended Data Fig. 7. Verification of monosynaptic connections between MPOA and VTA/PAG.
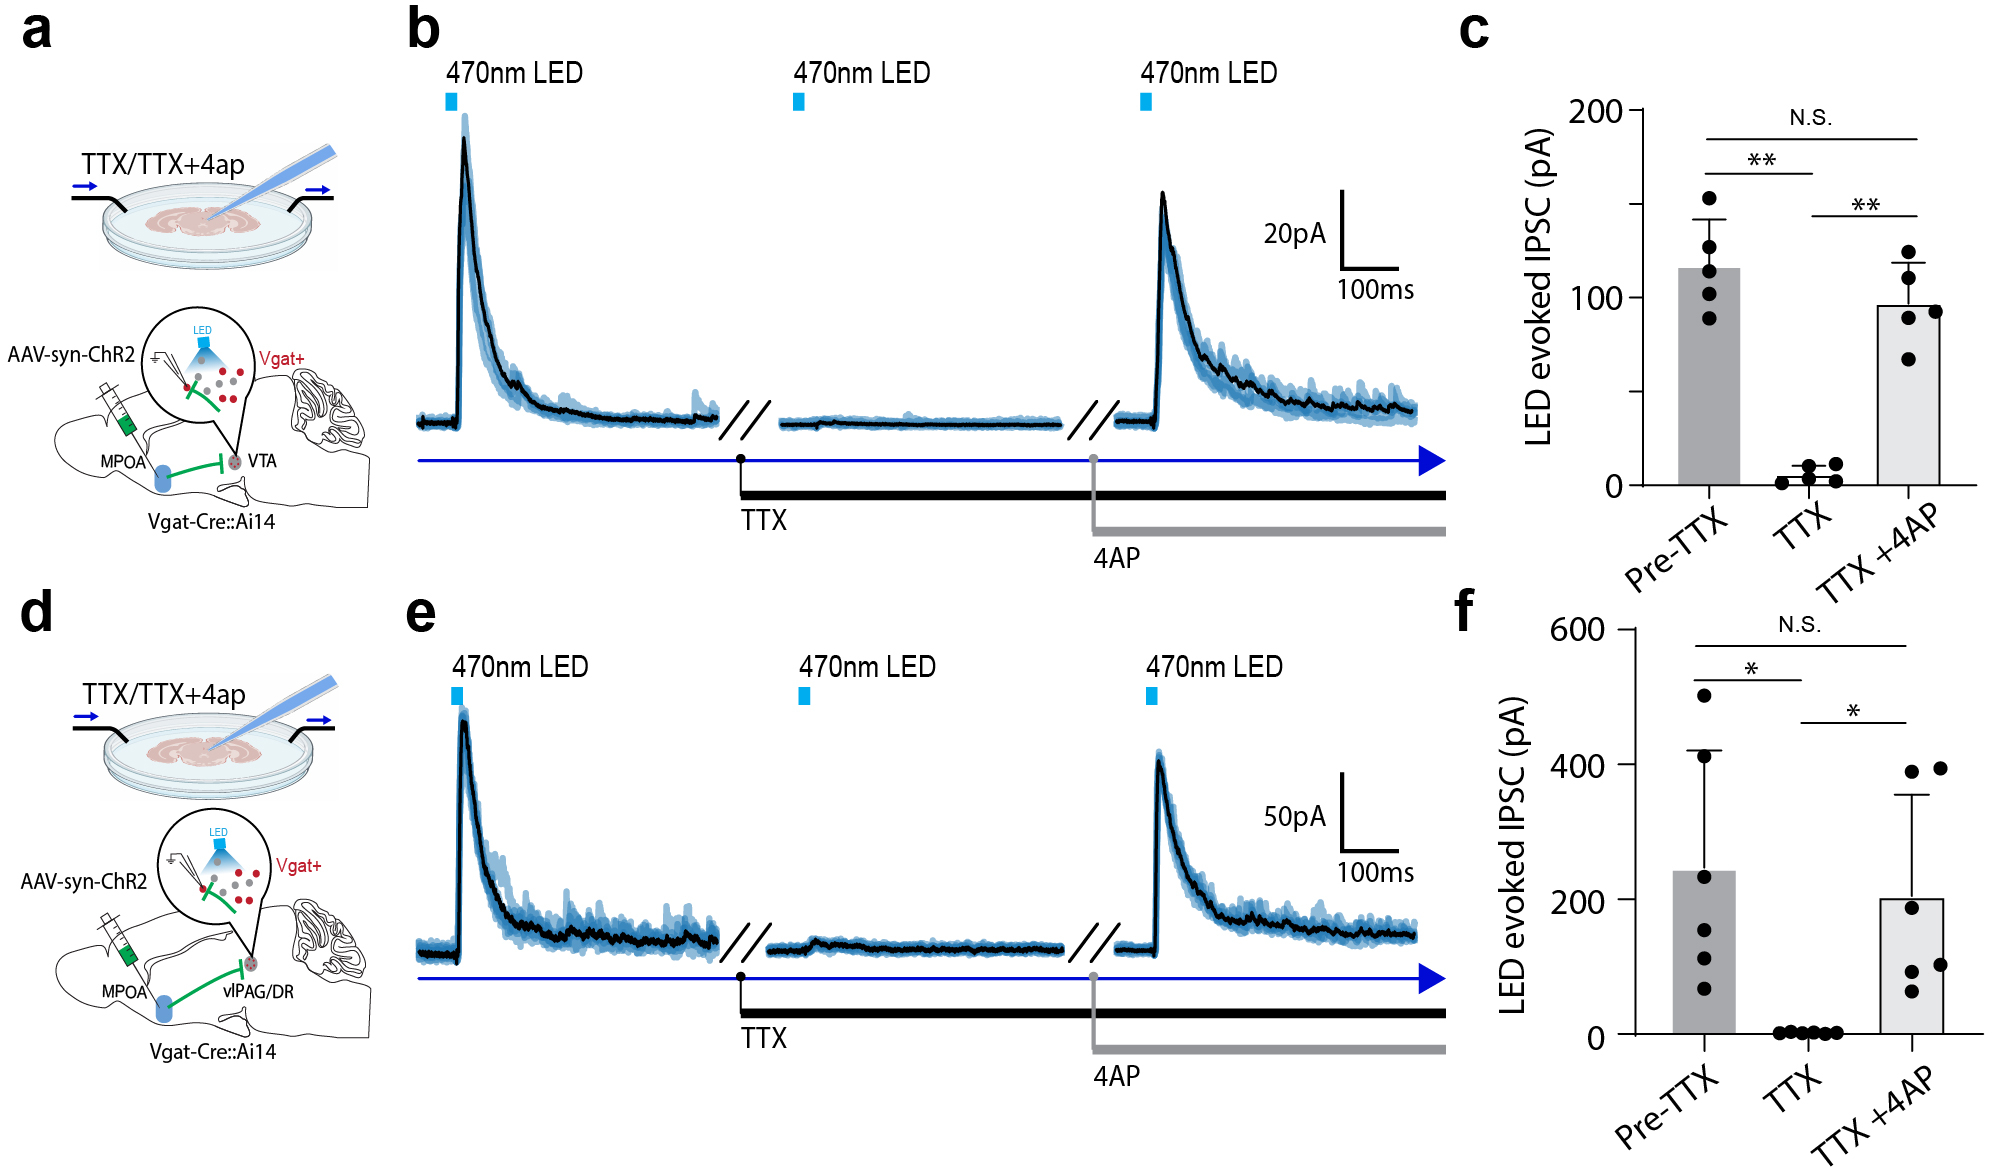
a, Whole-cell patch clamp recording from Vgat+ neurons in VTA of Vgat-Cre::Ai14 mice. AAV-syn-ChR2 was injected into MPOA. b, Averaged trace (black, n = 5 trials) of light-evoked inhibitory synaptic responses (recorded at 0mV) in the control condition, after application of TTX and after co-application of TTX and 4AP. Blue shade represents raw traces. c, Mean IPSC amplitudes in the three conditions. Pre-TTX vs TTX, **P = 0.0013. Pre-TTX vs TTX+4AP, N.S. P = 0.1518, TTX vs TTX+4AP, **P =0.0017, repeated measures one-way ANOVA with multiple comparisons, n = 5 cells in each group, from 2 animals. Error bar, s.d. d, Whole-cell recording from Vgat+ neurons in vlPAG of Vgat-Cre::Ai14 mice. AAV-syn-ChR2 was injected into MPOA. e, Averaged trace (black, n = 5 trials) of light-evoked inhibitory synaptic responses (recorded at 0mV) in the control condition, after application of TTX and after co-application of TTX and 4AP. Blue shade represents raw traces. f, Mean IPSC amplitudes in the three conditions. Pre-TTX vs TTX, *P = 0.0401. Pre-TTX vs TTX+4AP, P = 0.1151, TTX vs TTX+4AP, n = 6 cells from 3 animals in each group. Error bar, s.d., **P = 0.0468. Repeated measures one-way ANOVA with multiple comparisons.