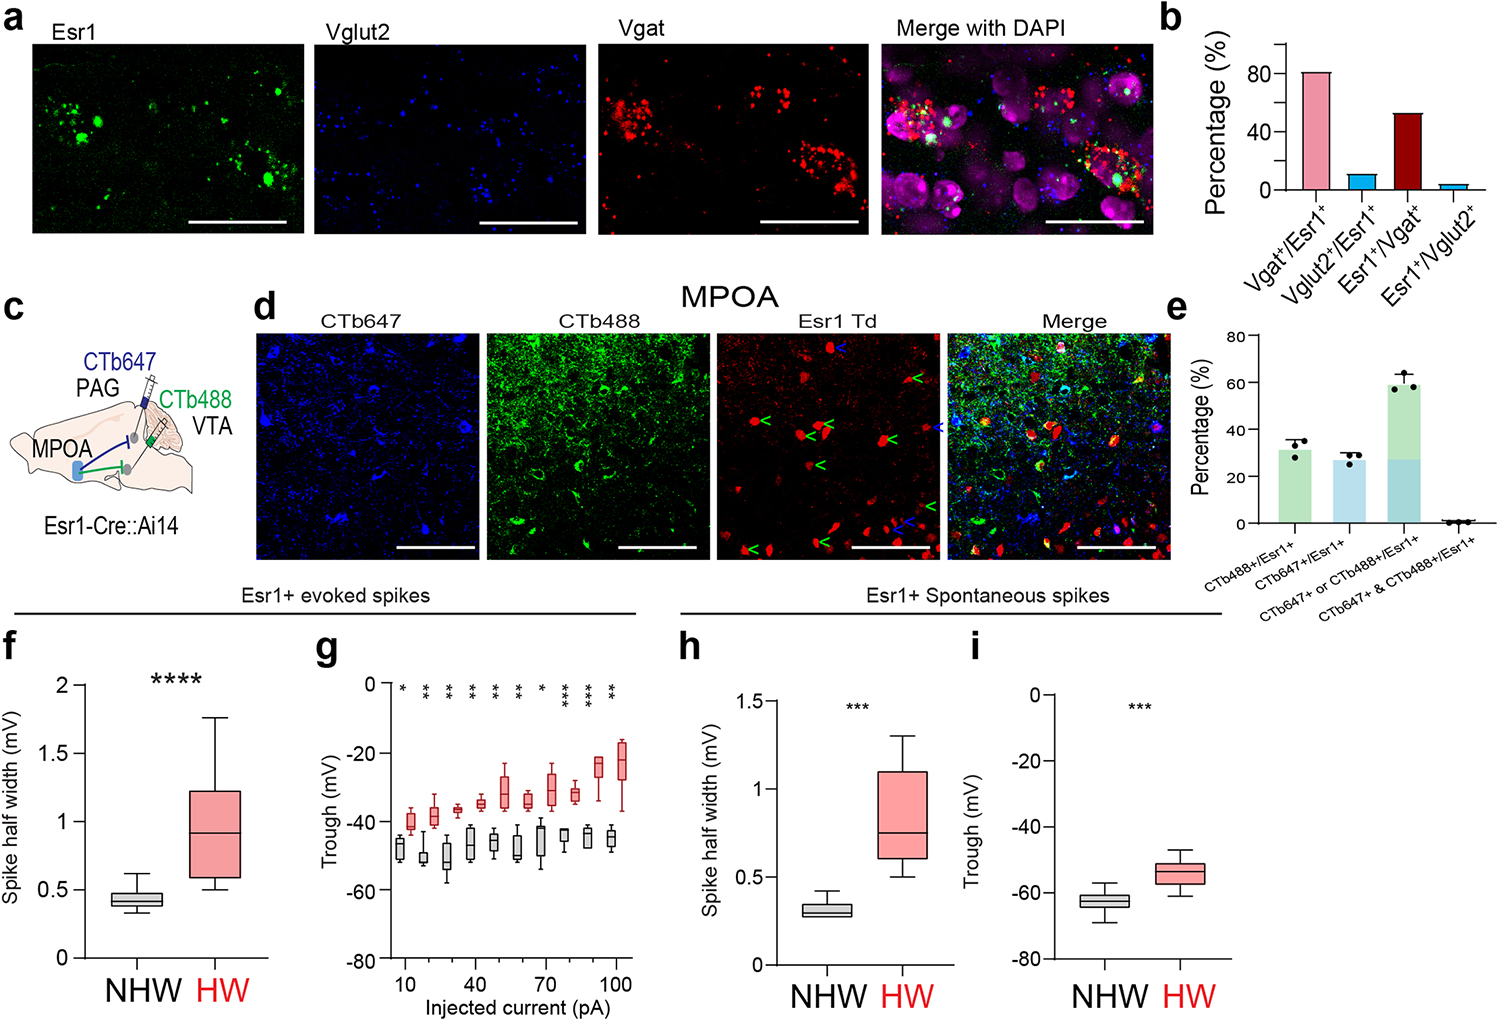
Extended Data Fig. 9. Esr1+ neurons in MPOA and their target specificity and spike features.

a, RNAscope staining of Esr1, Vglut2 and Vgat in MPOA. Scale bar, 50um. b, Percentage of neurons in different specific categories. 80% of Esr1+ neurons were Vgat+. c, Dual-color CTb retrograde tracing of MPOA neurons projecting to VTA and PAG in Esr1-Cre::Ai14 mice. d, Images in MPOA. Arrows indicate Esr1+ (tdTomato+) neurons co-labelled with CTb647 (blue, from PAG) or CTb488 (green, from VTA). Scale bar, 100μm. e, Percentage of neurons in specific categories. 60% of Esr1+ neurons were labeled by either CTB647 or CTb488. Mean ± s.d., n = 3 animals. f, Average half-peak spike width of MPOA Vgat+ neurons for spikes evoked by current injections in NHW and HW slices. n=14 cells for NHW group and 12 cells for HW group, from 3 animals in each group. ****P < 0.0001, two-tailed Mann-Whitney test. g, Average trough voltage at different injection current amplitudes. n = 6, 6 cells for NHW and HW group, from 3 animals respectively. *P < 0.05, **P < 0.01, ***P < 0.001, two-way repeated measures ANOVA. h, Average half-peak spike width of spontaneous spikes of MPOA Esr1+ neurons in NHW (n=10 cells from 3 animals) and HW (n=10 cells from 3 animals) slices. ***P = 0.0002, two-tailed Mann-Whitney test. i, Average trough voltage of spontaneous spikes. n=10,10 cells for NHW and HW group, from 3 animals for each group. ***P = 0.0002, two-tailed Mann-Whitney test. For boxplot, centerline, mean, upper and lower end, 90 and 10 percentiles.
