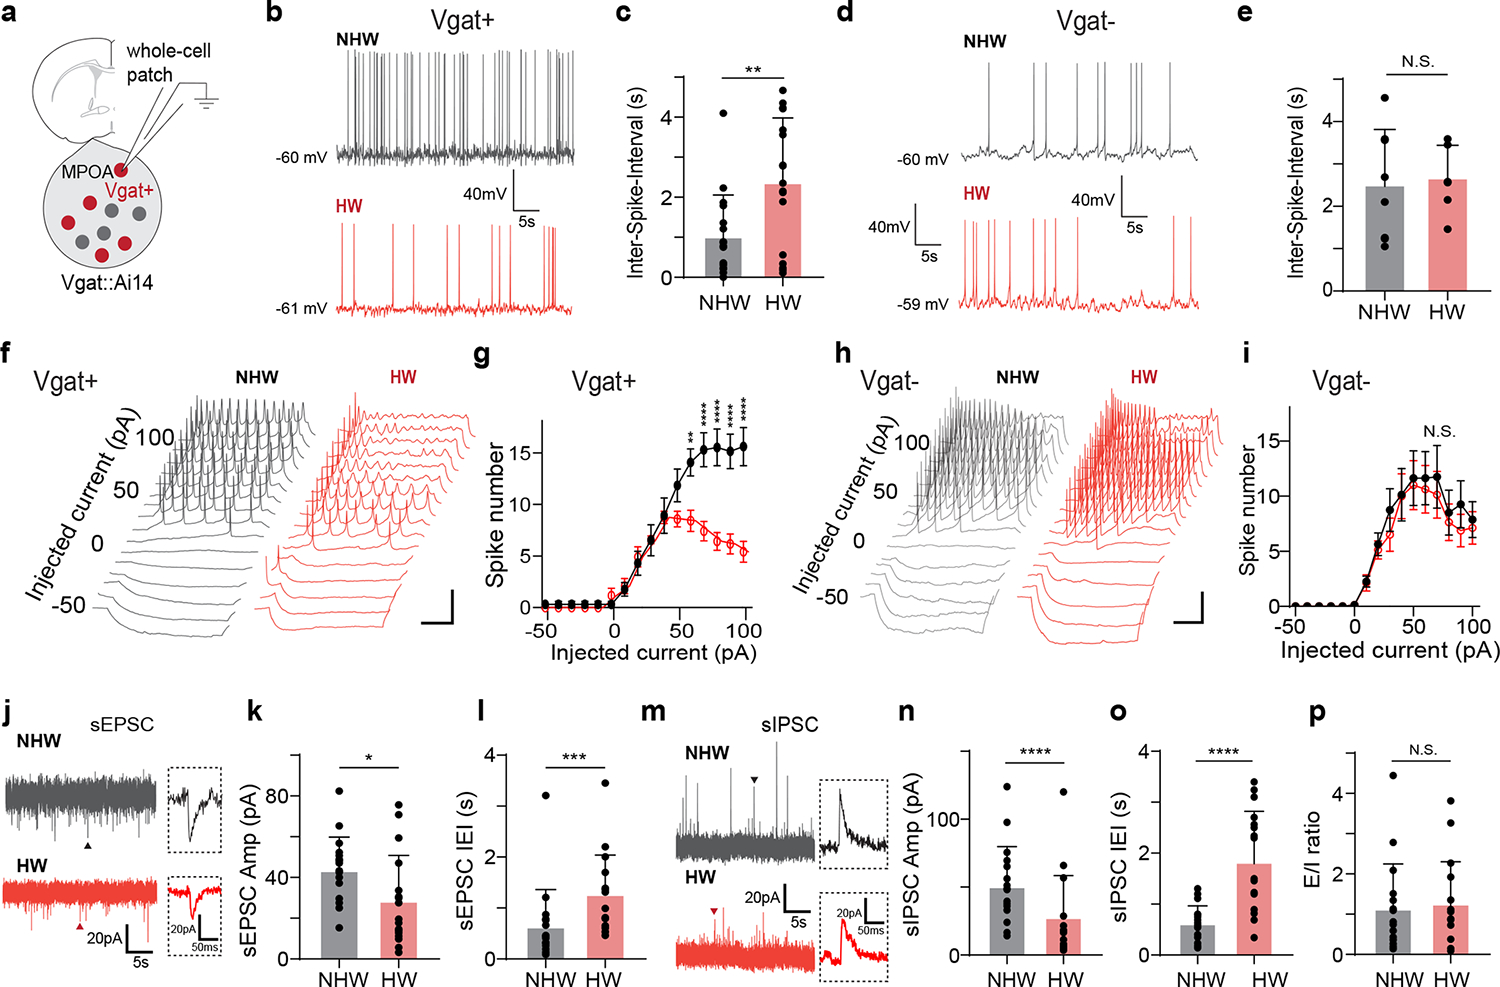
Fig. 2. Cellular changes underlying the hypoactivity of MPOA GABAergic neurons.

a, Whole-cell patch clamp recording from MPOA Vgat+ neurons (tdTomato+) in brain slices of female Vgat-Cre::Ai14 mice. b, Example recorded traces of spontaneous spikes from a NHW (gray) and HW (red) Vgat+ neuron. Resting membrane potential is indicated. Scale: 40mV, 5s. c, Mean ISIs in NHW-control and HW-treated groups (n = 17 and 17 cells respectively, from 4 animals in each group). **P = 0.0067, two-tailed t-test. Error bar, s.d. d-e, Mean ISI analysis for Vgat- neurons (n = 8 for cells NHW and 8 cells for HW, 4 animals in each group). N.S. P = 0.7576, two-tailed t-test. Error bar, s.d. f, Example traces of membrane potential responses to step current injections in a NHW (gray) and HW (red) Vgat+ neuron. Scale: 20mV, 200ms. g, Average input-output function of Vgat+ neurons in NHW-control (n = 13 cells, grey,) and HW-treated groups (n = 13 and12 cells respectively, from 4 animals in each group). Error bar represents s.e.m. P < 0.0001, two-way ANOVA, interaction F15,368 = 46.91. 60pA, **P = 0.0016; 70–100pA, ****P < 0.0001, Sidak’s multiple comparisons. h-i, The input-output function of MPOA Vgat- neurons in NHW-control (gray) and HW-treated (red) groups (n = 8 and 8 cells respectively, from 4 animals in each group) animals. Scale: 20mV, 200ms. P = 0.7162, two-way ANOVA. Error bar, s.e.m. j, Example recorded traces of sEPSCs in Vgat+ neurons in NHW (gray) and HW (red) slices. Scale: 20mV, 200ms. k-l, Mean amplitudes (k) and inter-event-intervals (IEIs) (l) of sEPSCs in NHW-control and HW-treated slices (n = 17 and 17 cells respectively, from 4 animals in each group). *P = 0.0333 (k), ***P = 0.0006 (l), two-tailed t-test. Error bar, s.d. m-o, Similar to k-l but for sIPSCs (n = 17 and 17 cells for NHW and HW respectively, from 4 animals in each group) recording. Scale: 20mV, 200ms. ****P < 0.0001 (n), ****P < 0.0001 (o), two-tailed t-test. p, Overall E/I ratio. N.S., P = 0.7614, two-tailed t-test, n= 17 cells from 4 animals in each group. Error bar, s.d. For exact P values, see Figure 2 Source Data.
