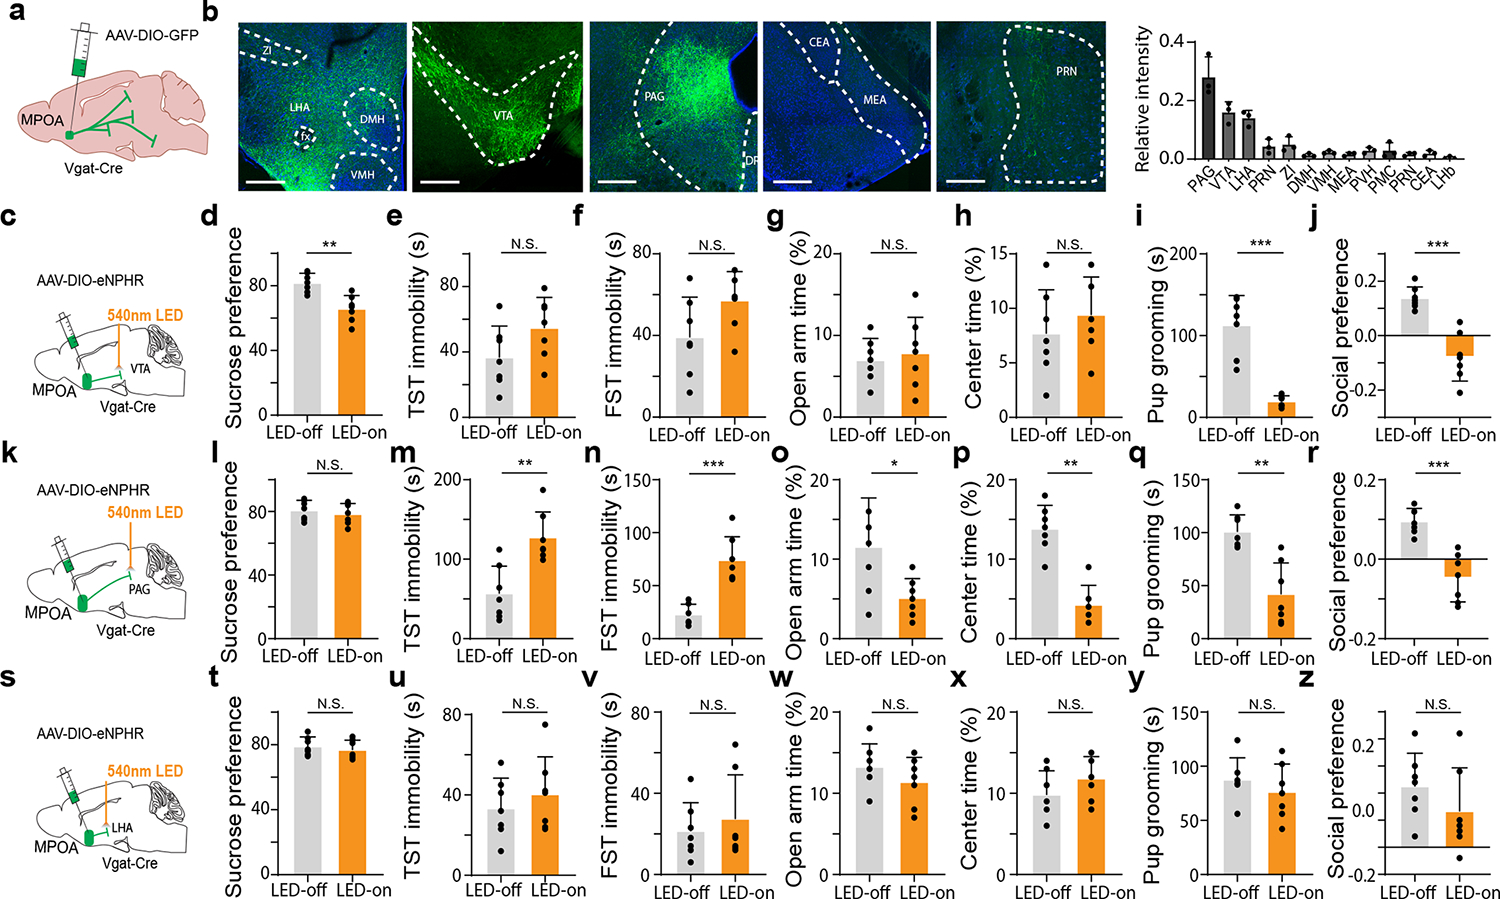
Fig. 3. Silencing of MPOAGABA→VTA and MPOAGABA→PAG projections induces different effects on depressive-like behaviors.

a, Schematic of anterograde tracing of MPOA Vgat+ axons. b, Left five panels, example images showing GFP-labeled axons in several different downstream regions. Right, quantification of relative fluorescence intensities in different targets (n = 3 animals). Scale bar, 500μm. Error bar, s.d. c, Schematic of viral injection and photo-inhibition of the MPOA GABAergic projection to VTA in normal female Vgat-Cre animals. d-j, Percentage sucrose water consumption in SPT (d), immobility time in TST (e) and FST (f), time spent in opened arms in EPM (g) and the center in OFT (h), time for pup grooming (i) and social preference index (j). Error bar, s.d. **P < 0.01, ***P < 0.001, two-tailed Mann-Whitney test, n = 7 mice. k-r, Similar to d-j but for photo-inhibition of the MPOA GABAergic projection to PAG. *P < 0.05, **P < 0.01, ***P < 0.001, two-tailed Mann-Whitney test, n = 7 mice. Error bar, s.d. s-z, Similar to d-j but for photo-inhibition of the MPOA GABAergic projection to LHA. N.S., P > 0.05, two-tailed Mann-Whitney test, n = 7 mice. Error bar, s.d. For exact P values, see Figure 3 Source Data.
