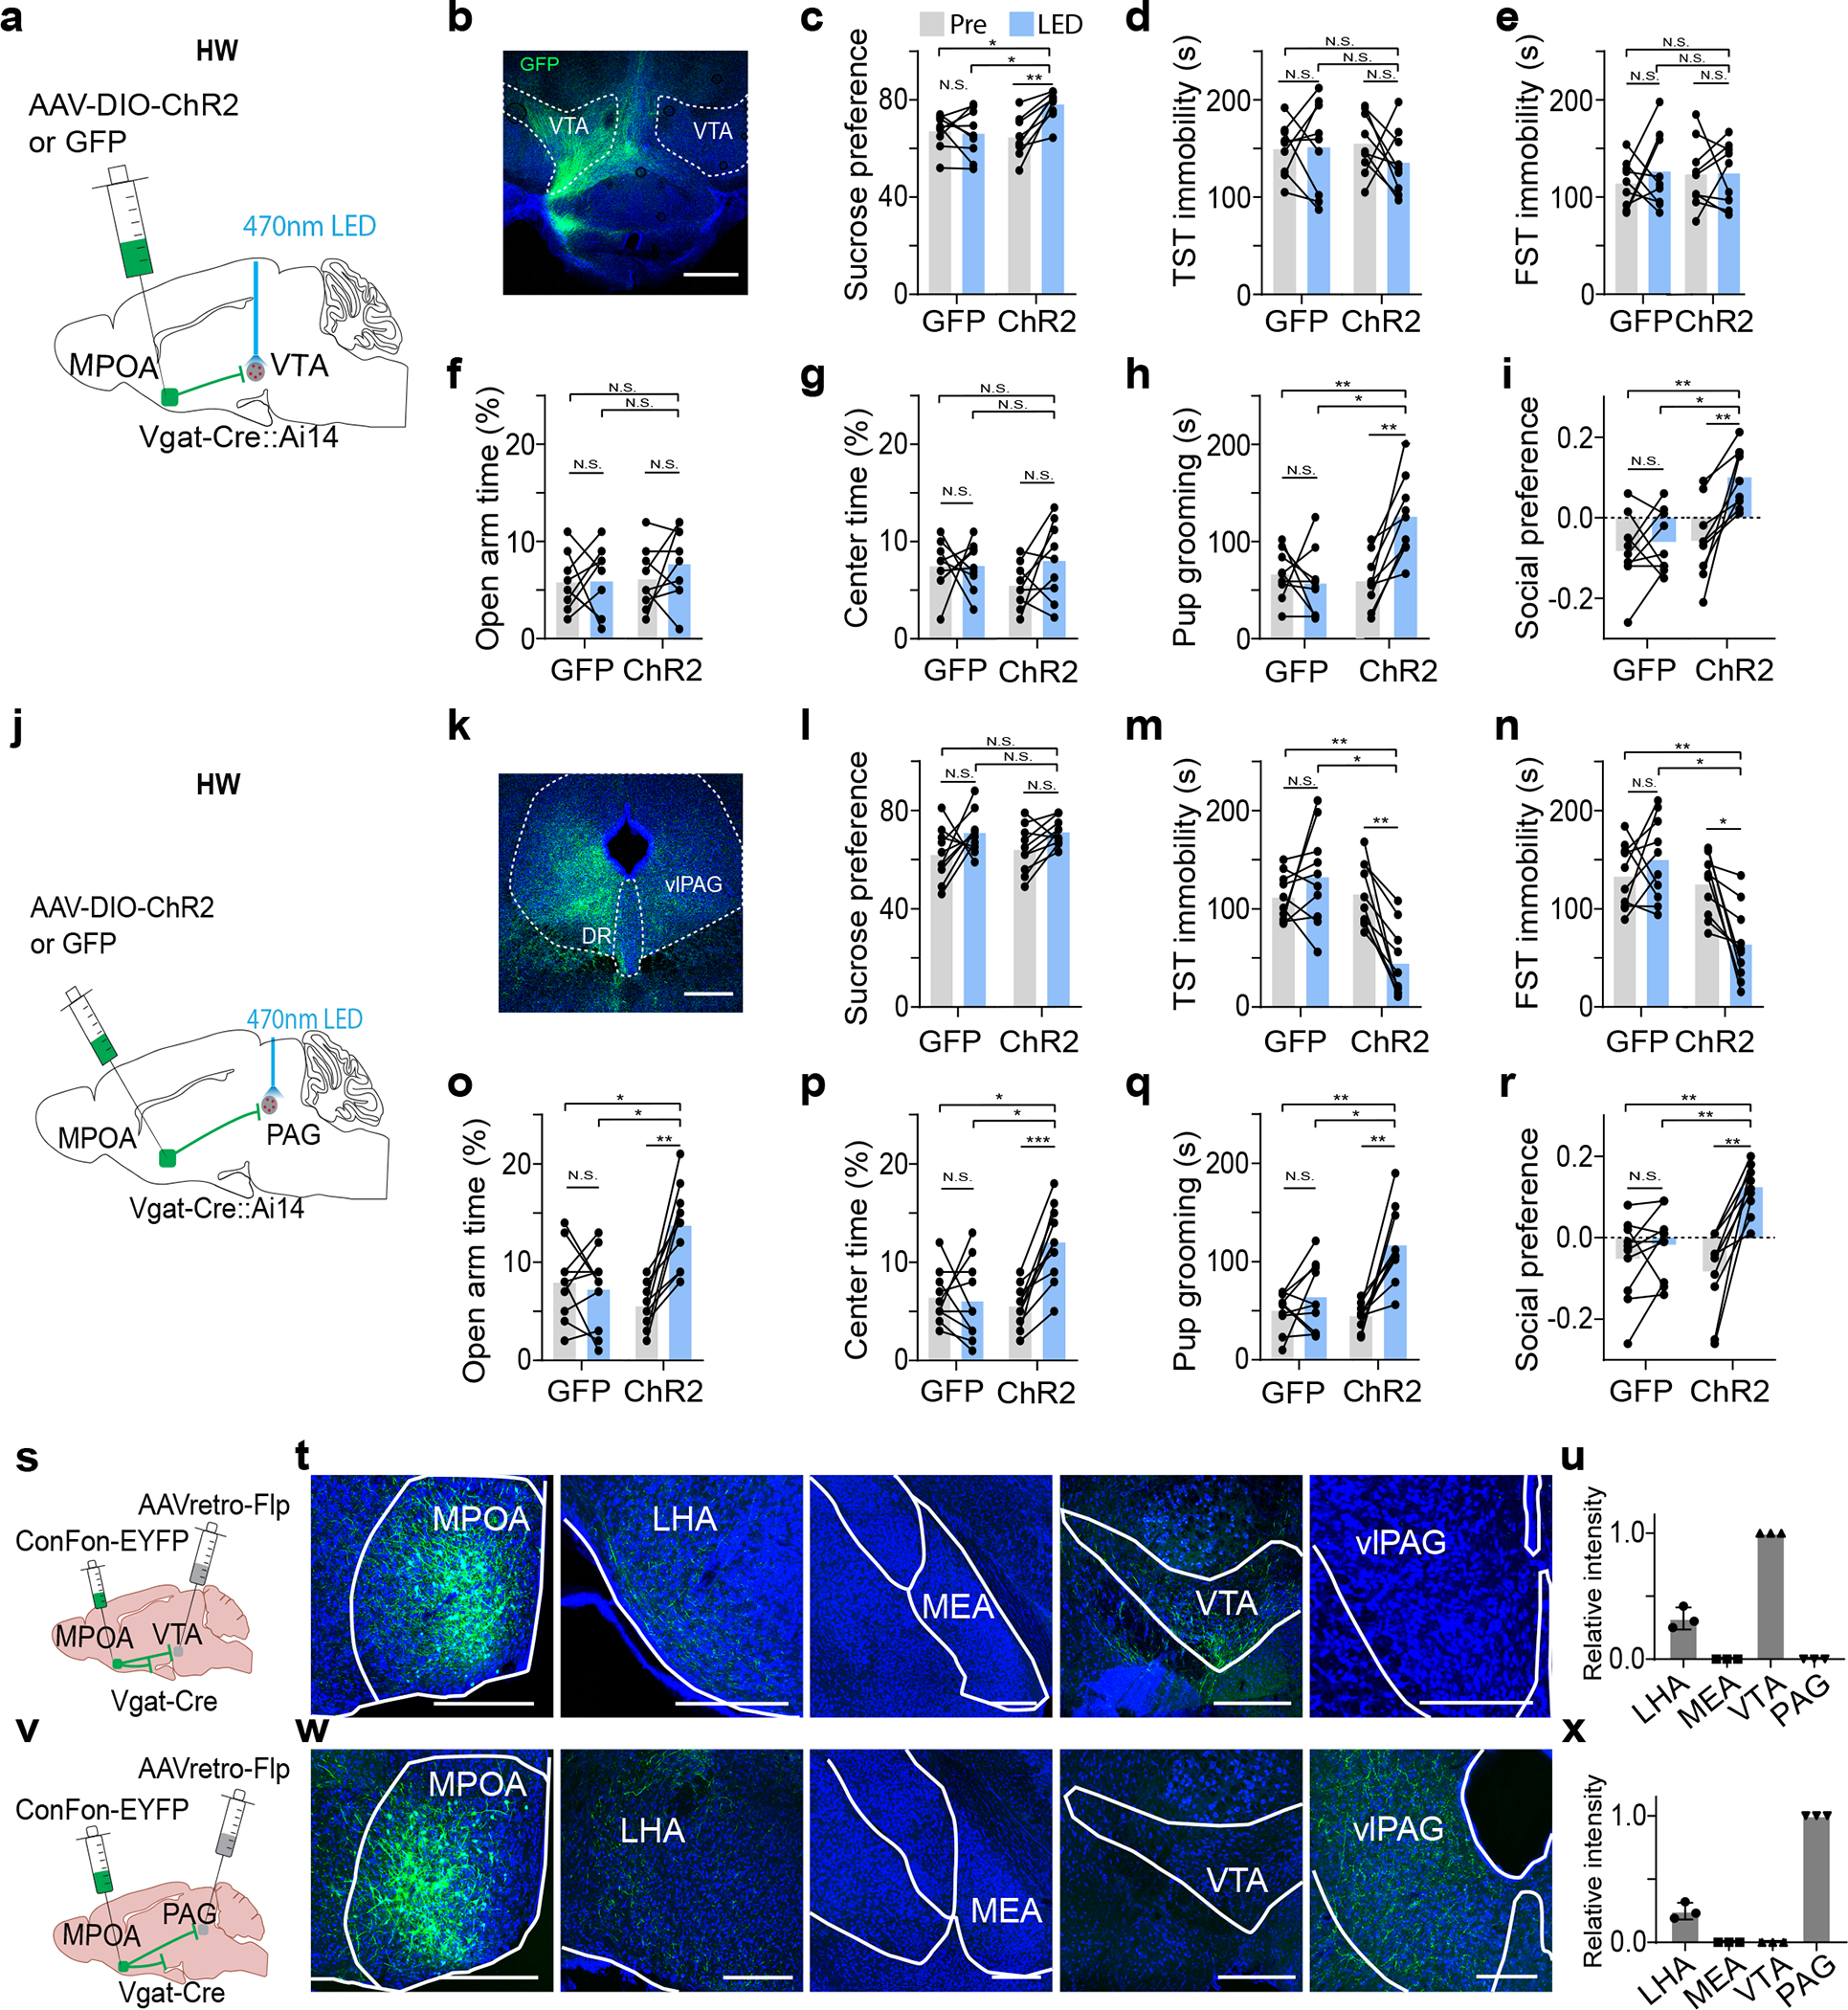
Fig. 4. Activation of MPOAGABA→PAG and MPOAGABA→VTA projections alleviates different features of depressive-like behaviors.

a, Schematic of photo-activation of MPOA→VTA GABAergic terminals in HW-treated animals. b, Example image showing GFP-labeled axonal terminals in VTA. Scale bar, 500μm. c-i, Percentage sucrose water consumption (c), immobility time in TST (d) and FST (e), percentage time spent in opened arms in EPM (f) and the center in OFT (g), time for pup grooming (h) and social preference index (i). N.S., P > 0.05, *P < 0.05, **P < 0.01, repeated measures one-way ANOVA test with multiple comparisons, n = 9 and 9 mice for GFP and ChR2 groups respectively. j-r, Similar to a-i but for photo-activation of MPOA→PAG GABAergic terminals. Scale bar, 500μm. *P < 0.05, **P < 0.01, ***P < 0.001, two-way repeated measures ANOVA test with multiple comparisons, n = 9 and 9 mice for GFP and ChR2 groups respectively. s, Schematic of collateral tracing of VTA-projecting MPOA Vgat+ neurons. t, Images showing EYFP-labeled axons in different areas. Scale bar, 500μm. u, Quantification of relative fluorescence intensity (mean ± s.d., n = 3 animals). v-x, Similar to s-u but for collateral tracing of PAG-projecting MPOA Vgat+ neurons (mean ± s.d., n = 3 animals). For exact P values, see Figure 4 Source Data.
