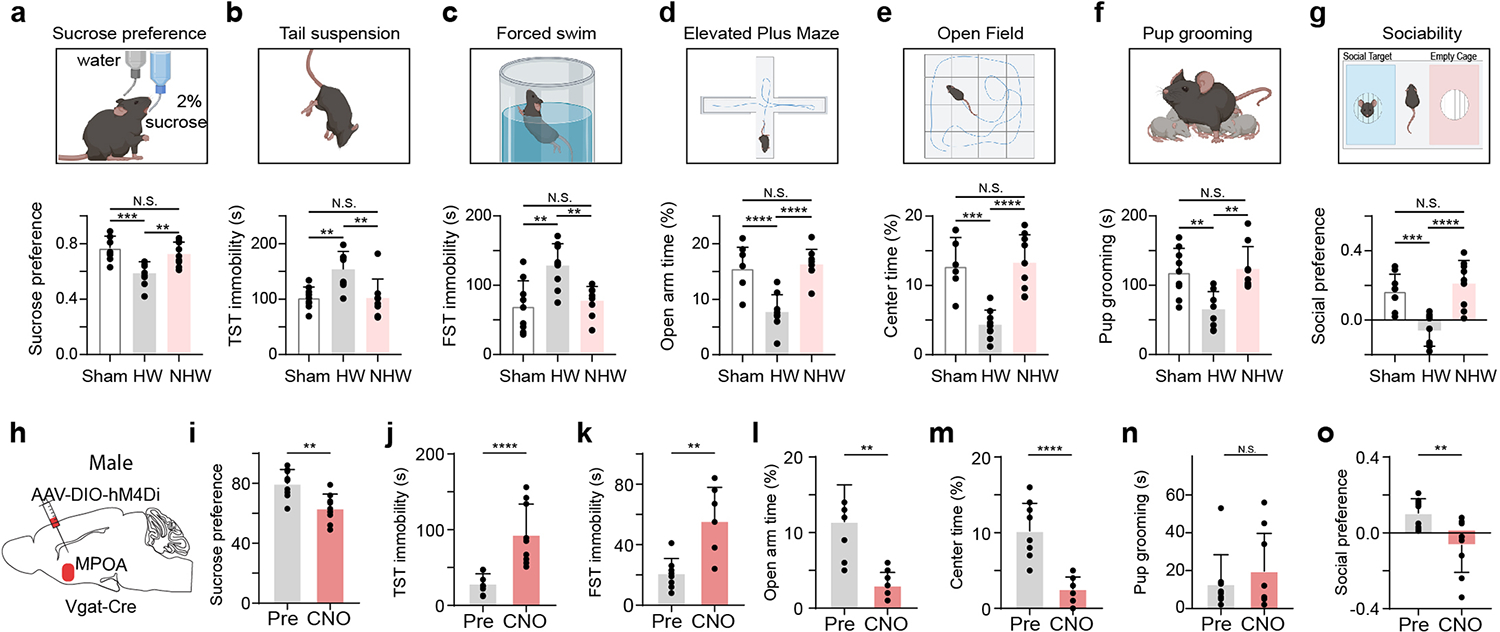
Extended Data Fig. 1. Ovarian hormone withdrawal induced depressive-like behaviors in female mice and effects of silencing MPOA GABAergic neurons in male mice.

a, Top, schematic behavioral assay of sucrose preference test (SPT). Bottom, percentage sucrose water consumption. Sham vs HW, ***P = 0.0004, NHW vs HW, **P = 0.0048, Sham vs NHW, N.S., P = 0.6103, two-tailed one-way ANOVA with postdoc hoc test, n = 9 mice in each group. b, Immobility time in tail suspension test (TST). Sham vs HW, **P = 0.003, NHW vs HW, **P = 0.0028, Sham vs NHW, N.S., P = 0.9997, two-tailed one-way ANOVA with postdoc hoc test, n = 9 mice in each group. c, Immobility time in forced swimming test (FST). Sham vs HW, **P = 0.0012, NHW vs HW, **P = 0.0048, N.S., P =0.8448, two-tailed one-way ANOVA with postdoc hoc test, n = 9 mice in each group. d, Percentage time spent in open arms in the elevated plus maze (EPM). ****P < 0.0001, N.S., P = 0.8923, two-tailed one-way ANOVA with postdoc hoc test, n = 9 mice in each group. e, Percentage time spent in the center in the open field test (OFT). ***P = 0.0001, ****P < 0.0001, N.S., P = 0.9562, two-tailed one-way ANOVA with postdoc hoc test, n = 9 mice in each group. f, Time of pup grooming. Sham vs HW, **P = 0.0036, NHW vs HW, **P = 0.0016, N.S., P = 0.9434, two-tailed one-way ANOVA with postdoc hoc test, n = 9 mice in each group. g, Social preference index in the three-chamber sociability test. ***P = 0.0006, ****P < 0.0001, N.S., P = 0.6586, one-way ANOVA with postdoc hoc test, n = 9 mice in each group. Data are presented as mean values +/− s.d.. h, Chemogenetic suppression of MPOA Vgat+ neurons by injecting AAV-DIO-hM4Di (or DIO-mCherry as control) in normal Vgat-Cre male animals. i-o, Various behavioral tests. Statistics: **P = 0.0024 (i), ****P < 0.0001 (j), **P = 0.0015 (k), **P = 0.0002 (l), ****P < 0.0001 (m), N.S., P = 0.8111 (n), **P = 0.0085 (o), two-tailed Mann-Whitney test, n = 9 mice in each group, mean ± s.d...
