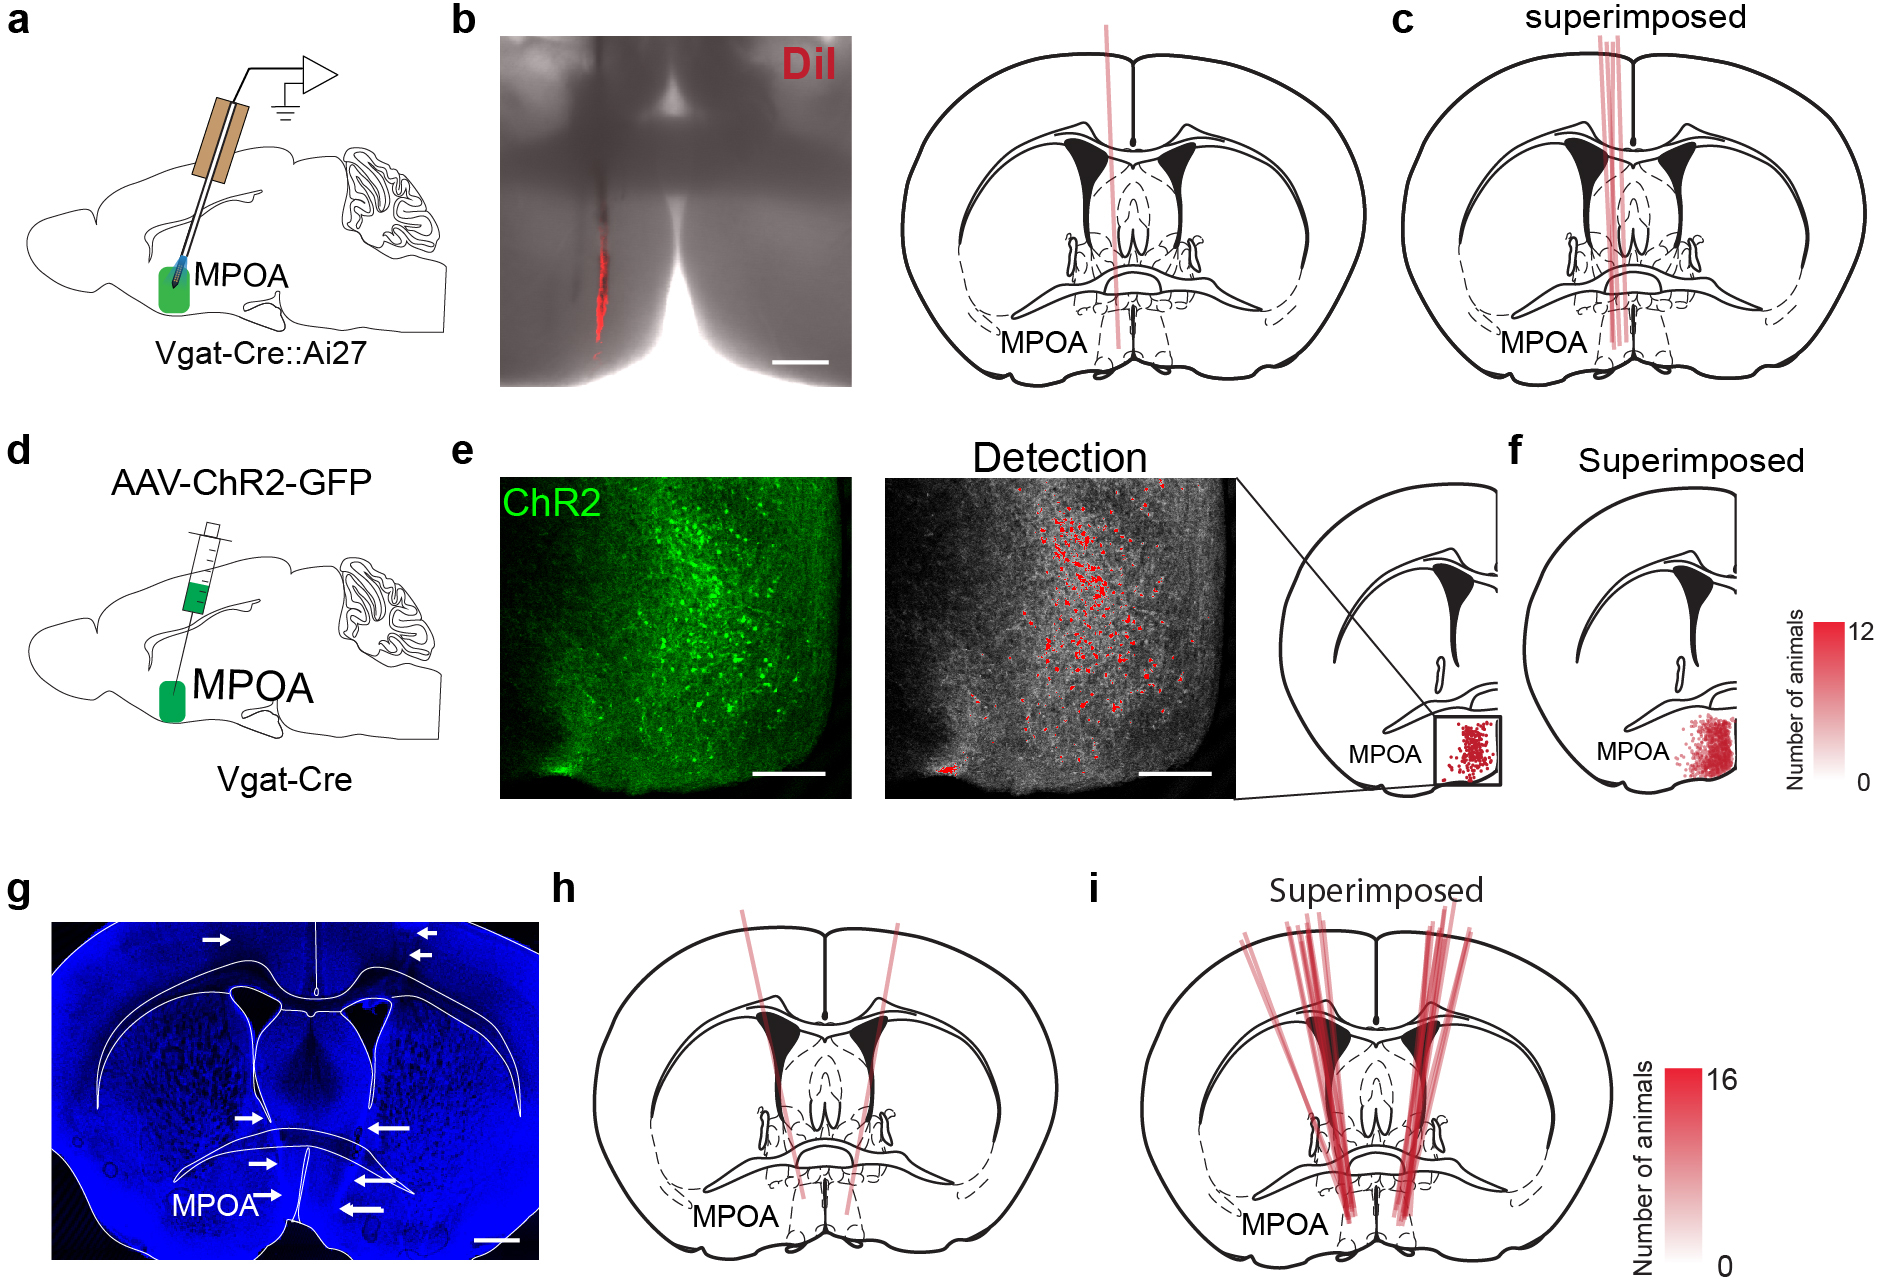
Extended Data Fig. 2. Post hoc verification of recording position, viral expression and cannula implantation.

a, Schematic of optrode recording in MPOA. b, Left, an example image showing the electrode track marked by DiI. Scale bar, 200 μm. Right, registration of the electrode track with the mouse brain atlas. c, Superimposed optrode tracks in different experiments. d, Schematic of stereotactic injection of AAV-DIO-ChR2-EYFP into MPOA. e, Expression of ChR2-EYFP in MPOA. Each red dot represents an individual neuron. Scale bar, 200 μm. Position of each cell is registered to the mouse brain atlas. f, Superimposed ChR2-expressing cells in different experiments. Opacity of pink color is proportional to the number of mice expressing the desired channel in that location. g, An example image showing the track of implanted drug cannula, highlighted by white arrows. Blue, Nissl staining. Scale bar, 500 μm. h, Registration of the cannula implantation with the brain atlas. i, Superimposed cannula implantation tracks in different experiments..
