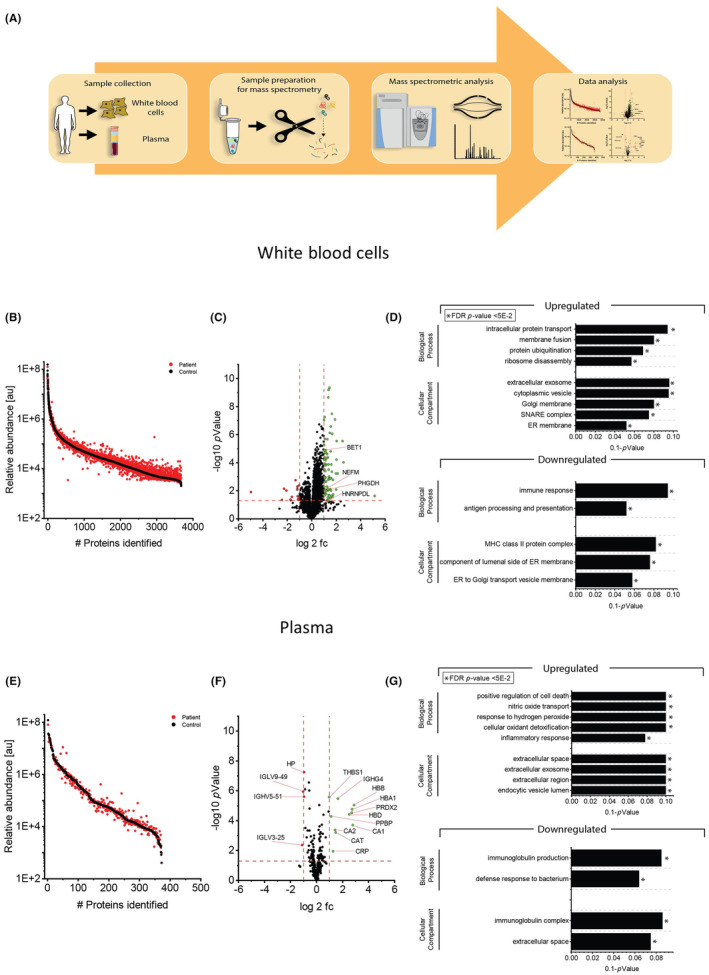
FIGURE 1.

Proteomic studies on VWA1‐patient derived blood samples. (A) Results of GTex‐based in silico analysis of VWA1 expression/transcript abundance in different tissues and cellular populations. (B) VWA1 protein abundances presented as ratios with respect to GAPDH level in in house generated spectral libraries (protein catalogues) of fibroblasts and skeletal muscle. (C) Schematic representation of the applied workflow to study the proteomic signatures of white blood cells and plasma from the same blood sample. (D) Abundance plot for proteomic profiling data obtained on white blood cells showing the dynamic range of all identified proteins. This is based on their relative quantification of the three highest abundant peptides for each protein, allowing protein comparison within an experiment. All identified proteins of the control (black) are sorted with decreasing abundance while the patient (red) was plotted in the same order to directly compare the different abundances. All identified proteins cover a dynamic range of eight orders of magnitude. (E) Volcano plot for proteomic findings obtained in white blood cells highlighting statistically significant increased proteins (green dots) as well as decreased proteins (red dots). Fc, fold change. Four proteins of particular neuromuscular relevance are highlighted. (F) Results of GO‐Term based in silico studies of proteomic findings in white blood cells show that increased proteins impact on intracellular protein transport, membrane fusion, protein ubiquitination and ribosome disassembly. Cellular compartments affected by increased protein abundances include membranes of the ER‐Golgi network as well as SNARE complex, extracellular exosomes and cytoplasmic vesicles (upper panel). Decreased proteins impact on immune response along with antigen processing and presentation and also affect the ER‐Golgi network (lower panel). (G) Abundance plot for proteomic profiling data obtained on plasma showing the dynamic range of all identified proteins. This is based on their relative quantification of the three highest abundant peptides for each protein, allowing protein comparison within an experiment. All identified proteins of the control (black) are sorted with decreasing abundance while the patient (red) was plotted in the same order to directly compare the different abundances. All identified proteins cover a dynamic range of eight orders of magnitude. (H) Volcano plot for proteomic findings obtained in plasma highlighting statistically significant increased proteins (green dots) as well as decreased proteins (red dots). (I) GO‐Term based in silico studies showed that increased proteins are indicative for positive regulation of cell death, oxidative stress burden (nitric oxide transport, response to hydrogen peroxide and cellular oxidant detoxification) and inflammatory response and impact on extracellular regions and endocytic vesicles as cellular compartments whereas decreased proteins are also indicative for immune response and affect the immunoglobulin complex and the extracellular space. Full names of proteins depicted in this figure are listed in Table 2 and Table S1.
