
Fig. 4.
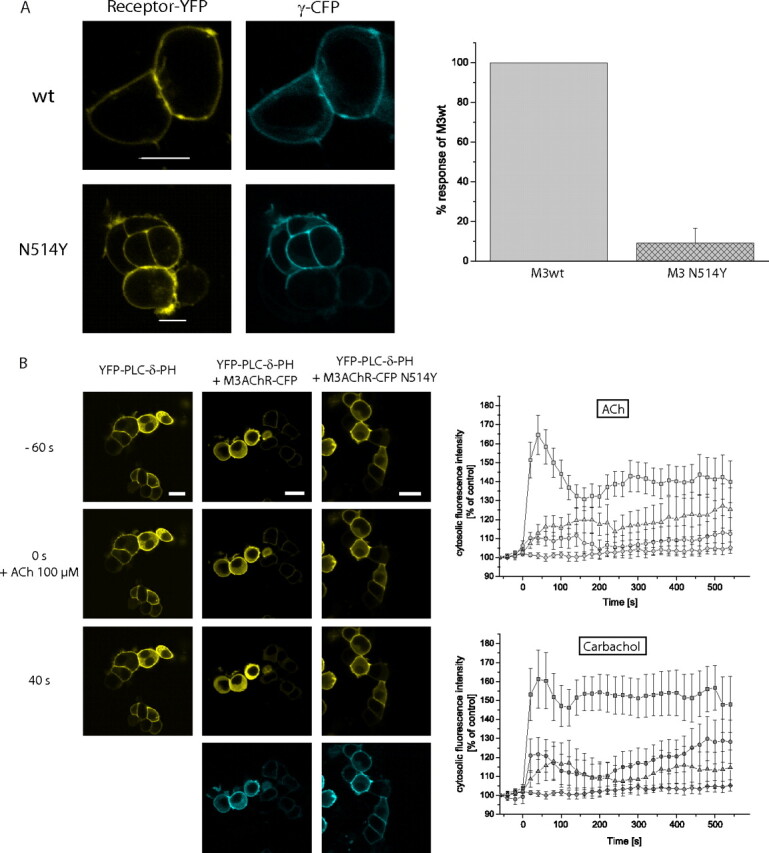
Analysis of M3-AChR-N514Y signaling dynamics in HEK293 cells. A, in HEK293 cells transiently expressing M3-AChR-YFP or M3-AChR-YFP-N514Y together with CFP-Gγ2 (and Gαq and β1) receptor (left) and Gγ2 (right) colocalize at the cell membrane (white scale bar, 10 μM). Upon stimulation with 100 μM ACh, the FRET ratio increased (see also Fig. 3) on average 4.0% for the M3-AChR-YFP receptor, whereas the average increase was only 0.5% for the M3-AChR-YFP-N514Y receptor (n = 7). B, in HEK293 cells transiently expressing YFP-PLC-δ1-PH alone or together with the M3-AChR-CFP or M3-AChR-CFP N514Y, YFP-PLC-δ1-PH and receptor localize to the plasma membrane (top row and CFP image, middle and right columns). Upon addition of ACh, PtdIns(4,5)P2 is converted to diacylglycerol and inositol 1,4,5-trisphosphate. Thus, the fluorescent probe relocates into the cytosol (middle row 0 s and bottom row 40 s). Scale bars, 20 μm. The dynamic increase in cytosolic fluorescence was quantified and plotted against time for each receptor construct tested. The upper right panel represents data for 100 μM ACh (data for HEK cells without M3-AChR (diamonds), data for HEK293 cells with M3-AChR-CFP (squares), data for HEK cells with M3-AChR-CFP-N514Y (triangles), and data for HEK cells with M3-AChR-N514Y (circles). The lower right panel shows the same experiments done with 1 mM carbachol (diamonds represent data for HEK293 cells without M3-AChR, squares represent data for HEK cells with M3-AChR-CFP, triangles represent data for HEK cells with M3-AChR-CFP-N514Y, and circles represent data for HEK cells with M3-AChR-N514Y). Each point represents mean ± S.E. values from 14 to 18 different cells recorded in five to seven independent experiments.