
Fig. 5.
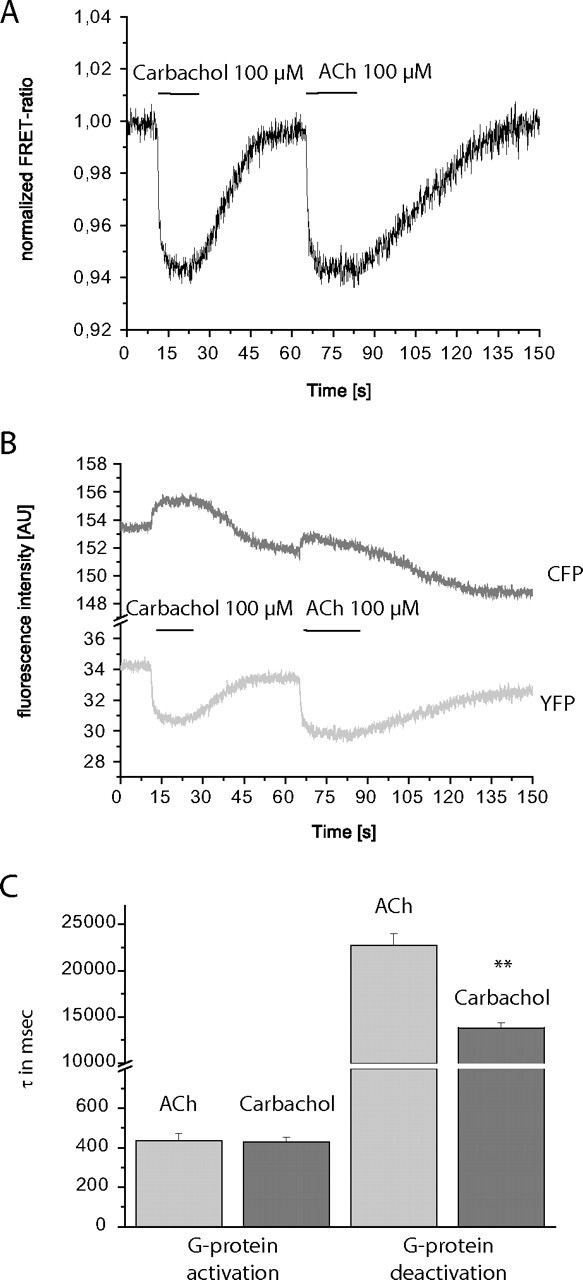
Analysis of G-protein activation by FRET. FRET was measured between YFP-tagged Gαq and CFP-tagged Gγ2. Excitation of CFP at 436 nm shifts the emission from 480 to 535 nm when the two fluorophores are close enough to permit FRET. A, HEK293 cells transiently expressing YFP-tagged Gαq together with CFP-Gγ2 (and M3-AChR and β1) were superfused with 100 μM carbachol or 100 μM ACh. This resulted in a rapid decrease in FRET as seen by the decrease in the normalized FRET ratio (FYFP/FCFP). The decrease in FRET was readily reversible upon agonist washout. B, upon superfusion with 100 μM carbachol or 100 μM ACh, an increase in CFP fluorescence and a decrease in YFP fluorescence were observed. C, maximal G-protein activation kinetics for ACh (light gray bars) and carbachol (dark gray bars) were compared with G-protein deactivation kinetics. Deactivation kinetics were analyzed similarly to activation kinetics (data represent means ± S.E. values; n = 18 for ACh and n = 17 for carbachol). AU, arbitary units.