Fig. 1.

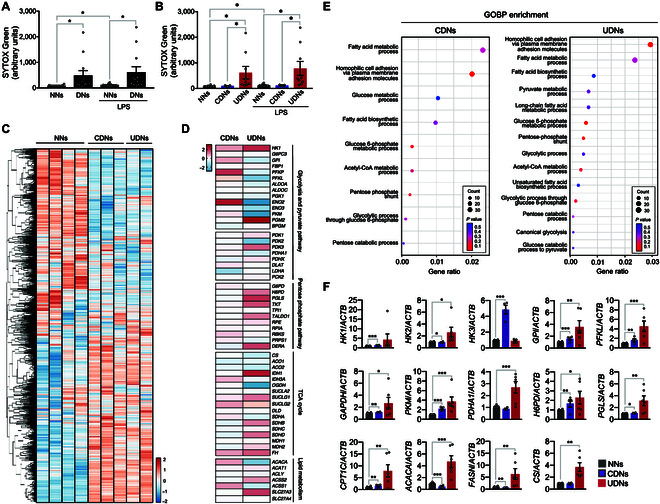
Metabolic reprogramming in neutrophils isolated from patients with diabetes. (A and B) Priming for NET formation in neutrophils isolated from patients with diabetes. Neutrophils were isolated from patients with diabetes (DNs) or healthy volunteers (NNs) in the presence or absence of LPS (10 μg/ml), and NET formation was analyzed using SYTOX Green staining. CDNs, neutrophils isolated from diabetic patients with controlled levels of HbA1c in serum; UDNs, neutrophils isolated from diabetic patients with uncontrolled levels of HbA1c. n = 12 per group. (C to E) RNA sequencing analysis of NNs (n = 4) and DNs (CDNs, n = 3; UDNs, n = 2). (C) Heatmap representations of DEGs in NNs and DNs. (D) Heatmap depicting DEG analysis of metabolic profiles of DNs with respect to NNs. (E) GO enrichment analysis of up-regulated genes in DNs. (F) A qPCR validation of enzymatic genes of metabolic pathways in DNs and NNs. NNs, n = 12; CDNs, n = 4; UDNs, n = 6. All results are expressed as means ± SEM. *P < 0.05; **P < 0.01; ***P < 0.001.
