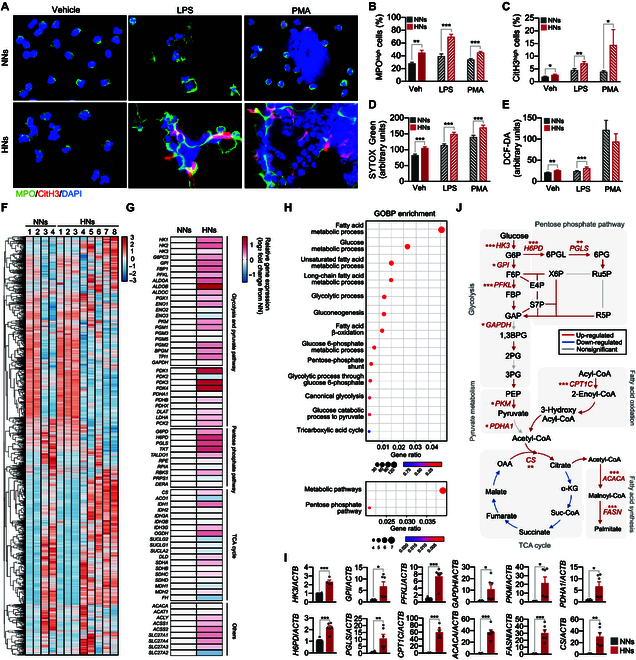
Fig. 2.

Metabolic pathways involved in high-glucose-induced NET priming. (A to E) The effect of high-glucose condition on the function of neutrophils. Human neutrophils were incubated in an RPMI medium supplemented with either 5.5 mM glucose (NNs) or 22 mM glucose (HNs) for 4 h. NNs and HNs were stimulated with LPS (10 μg/ml) or PMA (1 μg/ml) for 1 h. n = 4 to 7 per group. (A) Immunofluorescence images of NET formation in NNs and HNs. Representative images of 5 experiments are shown. Red, CitH3; green, MPO; blue, DAPI. (B and C) Percentages of MPOhigh (B) and CitH3high (C) neutrophils. (D) NET formation in NNs and HNs was determined by SYTOX Green staining. n = 7 per group. (E) ROS generation in NNs and HNs was determined by DCF-DA staining. n = 5 per group. (F to J) RNA sequencing analysis of NNs and HNs. n = 4 per group. (F) Heatmap representation of DEGs in NNs and HNs. (G) Heatmap depicting DEG analysis of metabolic profiles in NNs and HNs. (H) GO enrichment analysis of up-regulated genes in HNs. (I) A qPCR validation of the enzymatic genes of metabolic pathways in NNs and HNs. n = 6 per group. (J) Schematic depicting altered metabolic pathways in HNs based on KEGG metabolic pathway mapping and qPCR. Adjusted P < 0.05 was considered to indicate statistical significance for KEGG metabolic pathway mapping (colored arrows). The significant alterations in genes involved in metabolic pathways on qPCR analysis were denoted by asterisks. All results are expressed as means ± SEM. *P < 0.05; **P < 0.01; ***P < 0.001.
