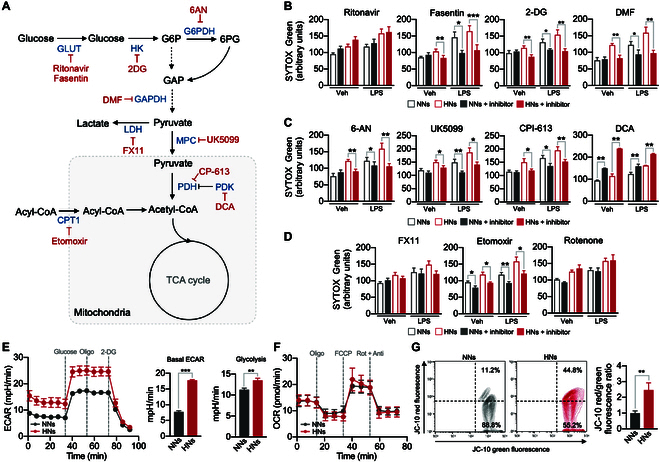
Fig. 3.

Metabolic modulation mediates NET priming. (A) Schematic depicting the inhibitors of the metabolic pathways. (B to D) The effects of inhibitors on metabolic pathways in high-glucose-induced NET priming. Neutrophils were incubated with either 5.5 mM glucose medium (NNs) or 22 mM glucose medium (HNs) in the presence or absence of the indicated inhibitors of metabolic pathways and then stimulated with LPS (10 μg/ml). The NET formation was analyzed using SYTOX Green staining. n = 5 to 7 per group. (E) Quantification of ECARs in NNs and HNs. Oligo, oligomycin. n = 15 per group. (F) Quantification of OCRs in NNs and HNs. Rot, rotenone; Anti, antimycin A. n = 12 per group. (G) Representative flow cytometry plots of the membrane potential of neutrophils as measured using JC-10 fluorescence. Red, JC-10 aggregates; green, JC-10 monomers. The bar graph shows the ratios of JC-10 aggregate and JC-10 monomer expression in neutrophils. n = 3 per group. All results are expressed as means ± SEM. *P < 0.05; **P < 0.01; ***P < 0.001.
