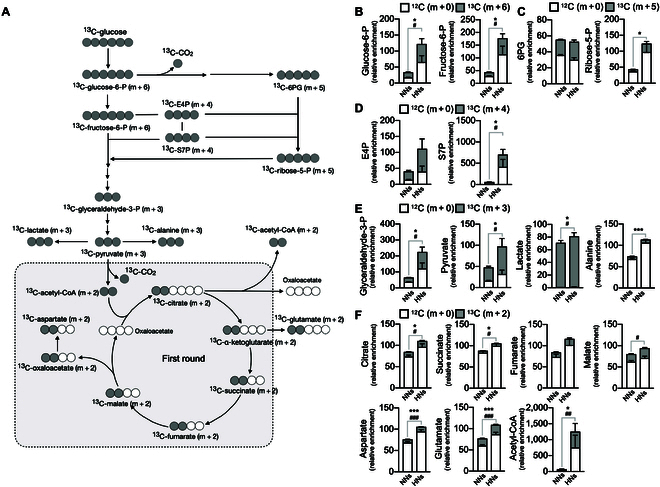
Fig. 4.

Validation of metabolic modulation in HNs through U-13C glucose tracing. Metabolic flux analysis in NNs and HNs. Neutrophils were incubated in a medium supplemented with U-13C glucose, and the fates of labeled carbon were traced using LC-mass spectrometry. The relative enrichment with respect to concentration of each metabolite from NNs was shown. (A) The schematic diagram for incorporation and distribution patterns of U-13C glucose into downstream metabolites associated with glycolysis, PPP, and TCA cycle. (B to F) Distribution of U- 13C (m + 6) and 12C (m + 0) into different metabolites. (B) U-13C (m + 6) in glucose-6-phosphate (glucose-6-P) and fructose-6-phosphate (fructose-6-P). (C) U-13C (m + 5) in 6-phosphogluconate (6-PG) and ribose-5-phosphate (ribose-5P). (D) U-13C (m + 4) in erythose-4-phosphate (E4P) and seduheptulose-7-phosphate (seduheptulose-7-P). (E) U-13C (m + 3) in glyceraldehyde-3-phosphate (glyceraldehyde-3-P), pyruvate, lactate, and alanine. (F) U-13C (m + 2) in citrate, succinate, fumarate, malate, aspartate, glutamate, and acetyl-CoA. n = 3 to 5 per group. Data are presented as relative metabolite abundance and expressed as means ± SEM. *P < 0.05; ***P < 0.001; #P < 0.05; ##P < 0.01; ###P < 0.001.
