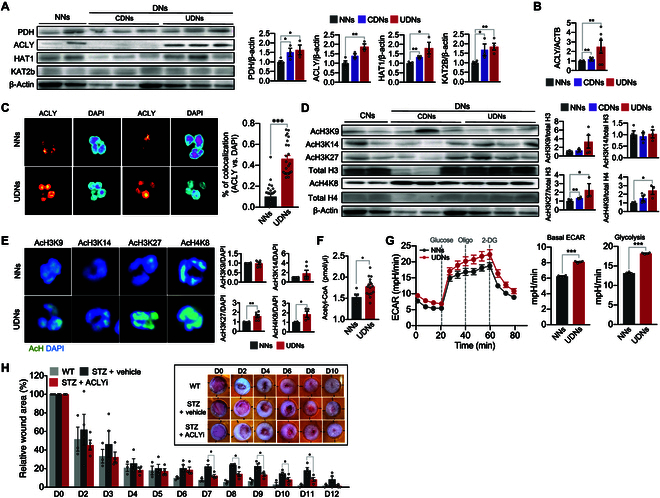
Fig. 6.

Diabetes primes NET formation via trained immunity. (A) Representative Western blotting images and bar graphs of the expression levels of PDH, ACLY, HAT1, and KAT2b in NNs and DNs. NNs, n = 4 to 5; CDNs, n = 3; UDNs, n = 4. (B) The expression levels of ACLY in NNs and DNs. NNs, n = 12; CDNs, n = 4; UDNs, n = 6. (C) Representative images of the subcellular localization of ACLY in DNs and CDNs using EzColocalization analysis. The bar graph denotes the probability of colocalization of ALCY with the nucleus in DNs and NNs using PCC metric. Each dot represents a single cell. Representative images of 3 independent experiments are shown. n = 3 per group. (D) Representative Western blotting images and bar graphs of the expression levels of acetylated histones in DNs and NNs. NNs, n = 4 to 6; CDNs, n = 4; UDNs, n = 3. (E) Representative confocal images depicting the levels of acetylation of the indicated histones in neutrophils. The bar graph shows the fold changes in the expression levels of the indicated acetylated histones in DNs compared to NNs. n = 2 to 3 per group. Each sample was analyzed in duplicates, resulting in 2 data point per sample. (F) The intracellular concentration of acetyl-CoA in NNs and DNs. NNs, n = 5; UDNs, n = 8. Each patient sample was analyzed in duplicates, resulting in 2 data point per patient. (G) Quantification of ECARs in DNs and NNs. n = 4 per group. (H) The effect of an inhibitor for ACLY on wound healing in a murine model of diabetes. The excisional dorsal full-thickness skin wounds (6 mm in diameter) were induced in the center of each dorsal skin of C57BL/6J mice. The wound closure results were quantified on days 1, 2, 4, 6, 8, and 10 after wounding. Inset: Representative photographs of wound healing. WT (wild-type control), n = 3; STZ + vehicle (vehicle-treated diabetic mice), n = 4; STZ + ACLYi (ACLY inhibitor-treated diabetic mice), n = 4. All results are expressed as means ± SEM. *P < 0.05; **P < 0.01; ***P < 0.001.
