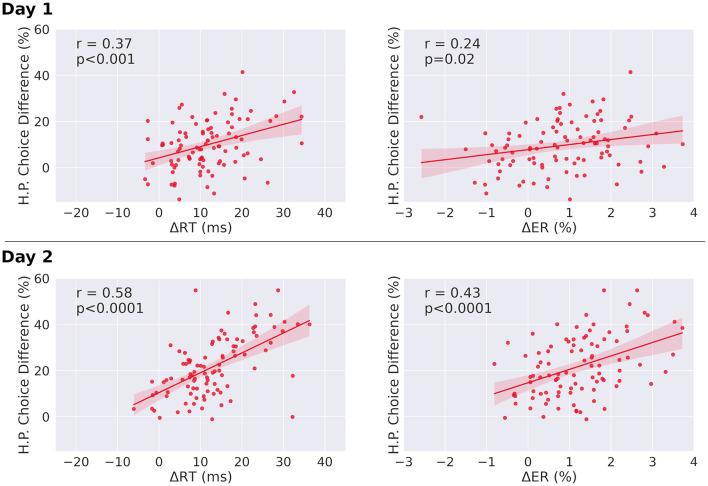
Figure 5.
Correlations between choice differences and both reaction time differences and error rate differences, in single-target trials. (Left) Correlation of individual H.P. choice frequency for congruent and incongruent trials (H.P. choice difference) and mean reaction time differences between sequential and random condition for single-target trials. Both slopes are significantly different from zero. The correlation coefficient of day two is significantly increased relative to day one (p < 0.0001). (Right) Correlation of individual H.P. choice frequency for congruent and incongruent trials (H.P. choice difference) and mean error rate differences between sequential and random condition for single-target trials. Both regression slopes are significantly different from zero. The correlation coefficient of day two is significantly increased relative to day one for both error rates and reaction times (p < 0.0001). The regression slope further increases from day one to day two for error rates (day 1: slope = 2.2, day 2: slope = 5.8, pdifference = 0.018), and for reaction times (day 1: slope = 0.48, day 2: slope = 0.86, pdifference = 0.03). ΔRT = RTRandom – RTSeq, ΔER = ERRandom – ERSeq. Analysis was performed after outlier removal (outliers were defined as elements more than three scaled median absolute deviations from the median). Results before outlier removal are similar for reaction times. For error rates, before outlier removal, the correlation is not significant for day one (r = 0.16, p = 0.12), but significant for day two (r = 0.40, p < 0.0001).

